
The market direction outlook for Friday November 14 2014 was for stocks to be a bit weak in the morning, attempt a rally but watch the rally fail. Part of the sideways momentum can be attributed to the overbought nature of the market in general but also the G20 meeting this weekend had many investors sitting idle. Ukraine remains front and center even though Australia wants to move the focus to economic and global growth. Investors are taking a wait and see attitude ahead of the weekend which accounted for a lot of the stocks moving sideways.
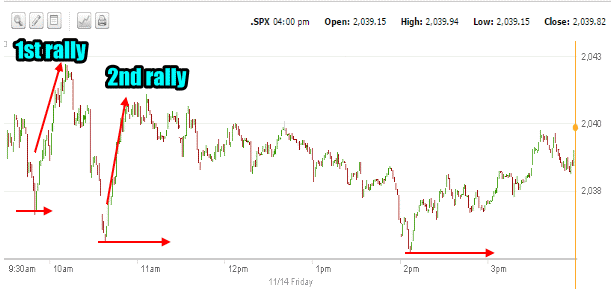
SPX Intraday for Nov 14 2014
The one minute chart below shows exactly what was expected. The morning opened weak and then there was a sharp rally. That rally failed which resulted in more selling and a lower low. This sparked a second rally which failed to recover the first rally high. This resulted in sellers once again stepping in and push stocks lower until by 2:00 PM the market was sitting in the red. The remainder of the day volume really dried up and the market drifted higher to a small positive close of 0.49 points. Basically unchanged from Thursday.
SPX Intraday for Nov 14 2014
Advance Declines For Nov 14 2014
Volume came in at 3.2 billion with 60% of all volume rising and 39% falling despite the sideways action. There were though just 86 new highs which is poor and 49 new lows. In general volume points to consolidation happening but the number of new highs is disappointing despite 60% of all volume rising. Often these numbers point to overbought markets.
Market Direction Closings For Nov 14 2014
The S&P closed at 2039.82 up 0.49. The Dow closed at 17,634.74 down 18.05. The NASDAQ closed at 4688.54 up 8.40.
Market Direction Technical Indicators At The Close of Nov 14 2014
Let’s review the market direction technical indicators at the close of Nov 14 2014 on the S&P 500 and view the market direction outlook for Nov 17 2014.
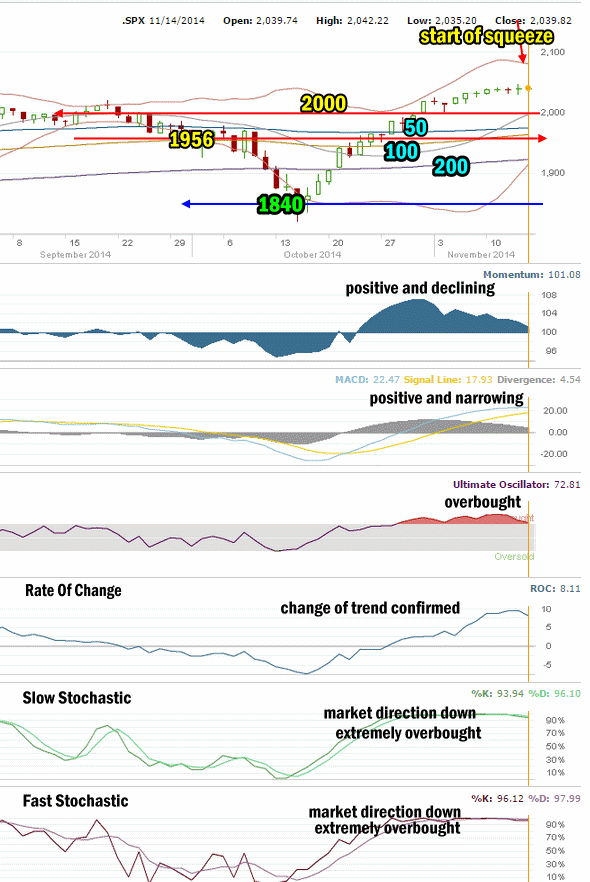
Market Direction Technical Analysis for Nov 14 2014
Stock Chart Comments: Stocks on Friday continued to basically drift sideways into the weekend. The 20 day simple moving average (SMA) is now firmly back above the 50 day simple moving average (SMA). Meanwhile a Bollinger Bands Squeeze is starting to form.
Strong Support Levels are at 1870 and 1840. Both levels are strong enough to delay the market falling. 1956 and 1970 are back as support for stocks. 2000 is the highest level of support at present and while not strong, it should have enough strength to hold sellers back for at least a day in the event of an interim pullback. I am not expecting this to happen at this stage of the rally. The market direction still looks like it wants to consolidate and then possibly move higher.
The other two support levels not shown in the chart above are 1775 and 1750. I have explained that these two are critical support for the present bull market. While 1775 is important it is 1750 that is now the bottom line.
A break of 1750 would mark a severe correction of more than 13% from the most recent high. This would be the biggest correction since April 2012. A pull-back of that size would definitely stun investors at this point and it is not something I am anticipating at this time.
Momentum: For Momentum I am using the 10 period. Momentum is still positive but continues to slide.
MACD Histogram: For MACD Histogram, I am using the Fast Points set at 13, Slow Points at 26 and Smoothing at 9. MACD (Moving Averages Convergence / Divergence) issued a buy signal on October 22. MACD is no longer gaining strength and is starting to indicate a possible change in the divergences. Still up but needs to be watched.
Ultimate Oscillator: The Ultimate Oscillator settings are: Period 1 is 5, Period 2 is 10, Period 3 is 15, Factor 1 is 4, Factor 2 is 2 and Factor 3 is 1. These are not the default settings but are the settings I use with the S&P 500 chart set for 1 to 3 months. The Ultimate Oscillator is positive and remains extremely overbought.
Rate of Change: Rate Of Change is set for a 21 period. The rate of change is staying positive and is now at 9.44 up from yesterday. The Rate Of Change is turning lower. Often a reading as high as we saw mid-week advises that a change is coming to the trend. We will know shortly if that change in trend is back to lower.
Slow Stochastic: For the Slow Stochastic I use the K period of 14 and D period of 3. As the Slow Stochastic tries to predict the market direction further out than just one day. The Slow Stochastic is signaling market direction is down and it is extremely overbought.
Fast Stochastic: For the Fast Stochastic I use the K period of 20 and D period of 5. These are not default settings but settings I set for the 1 to 3 month S&P 500 chart when it is set for daily. The Fast Stochastic is signaling down for stocks and is extremely overbought.
Market Direction Outlook And Strategy for Nov 17 2014
Technically there remains strength in the market but many indicators are starting to slide. Two are growing negative numbers, the Fast Stochastic and Slow Stochastic and they have been warning for a few days now that the market will move lower. Momentum is slipping but remains positive although it is definitely concerning to see the strong slide. MACD could issue a sell signal shortly but it too remains positive at the close.
The Ultimate Oscillator is probably the key here, showing investors a very overbought market and one that has been overbought for some time now. With the market unable to move higher a different catalyst to the upside may be needed. The Bollinger Bands Squeeze that is starting to develop could swing the market up or down. At this point it is difficult to judge. The G20 meeting on the weekend was probably not enough to boost stocks higher. Something else may be needed.
The outlook for Monday then is for stocks to perhaps bounce at the outset with the G20 meeting over and another unknown entity out of the way. We could then see some selling following an early morning bounce. The bias is now sideways but slightly lower for stocks.
Stay FullyInformed With Email Updates
Market Direction Internal Links
Profiting From Understanding Market Direction (Articles Index)
Understanding Short-Term Signals
Market Direction Portfolio Trades (Members)