
The market direction outlook for Monday was for stocks to move higher. The move higher was juiced by news out of China that the government would be adding more stimulus to their economy to improve the pace of expansion. We have all heard this before but still the news is always enough to get investors excited. The move was already pointing higher at the open although almost all the action was in the morning it was still an excellent day which saw new all time closing highs on the S&P and Dow. Let’s take a look.
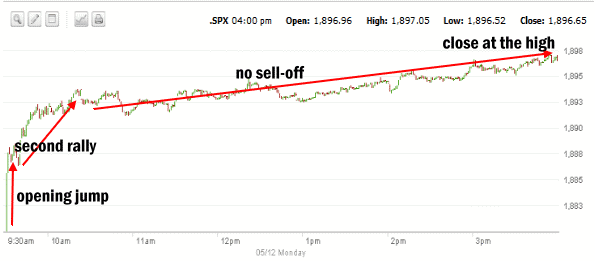
Market Direction S&P Intraday Chart May 12 2014
The 1 minute chart for Monday shows the terrific rally in the morning. The market opened higher and then a second rally within minutes of the open pushed stock up until shortly before 11:00. A slight pullback found no interested sellers so the market starting drifting sideways with a bias to the upside. All afternoon stocks slowly moved higher without any sell-off. Stocks closed at the end of the day at the highs which is normally a bullish signal for the following day..
Advance Declines For May 12 2014
Advancing issues dominated on Monday with 76% of stocks higher. Declining issues made up just 21% of stocks. New highs jumped to 182 from Friday’s 85 and new lows fell to 61 from Friday’s 106. Advance decline ratio is back swinging toward the upside once again.
Market Direction Closings For May 12 2014
The S&P closed at 1896.65 up 18.17. The Dow closed at 16,695.47 up 112.13. The NASDAQ closed at 4143.86 up 71.99 for a gain of 1.77%.
The Russell 2000 ETF, IWM, had the best gain of all the indexes rising 2.27% to close up $2.50 to $112.53.
Market Direction Technical Indicators At The Close of May 12 2014
Let’s review the market direction technical indicators at the close of May 12 2014 on the S&P 500 and view the market direction outlook for May 13 2014.
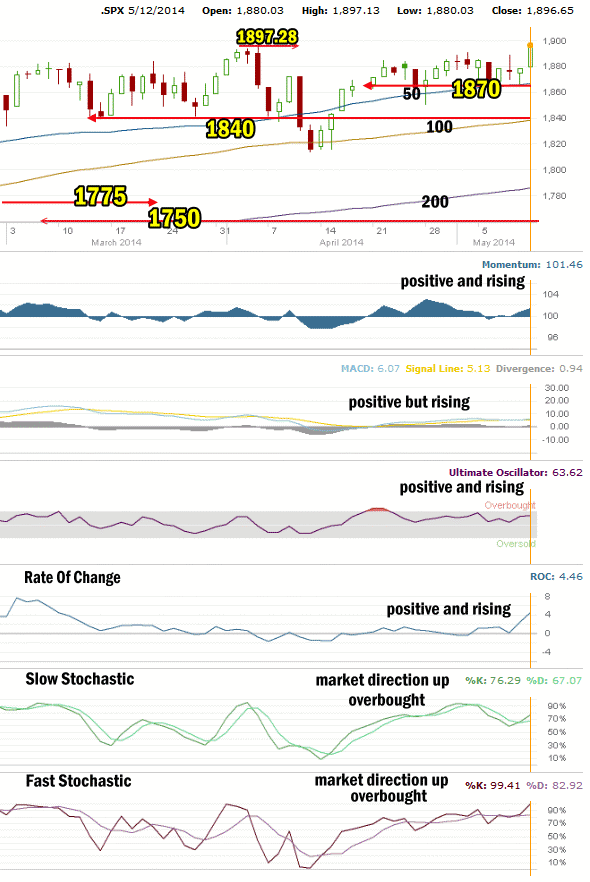
The 1750 level continues to hold the S&P up since the correction ended in early February. Levels above 1800 have regained support with two levels now in play. The first is back at 1840 and once again there is enough strength at that level to hold stocks probably for 2 to 3 days of selling. The next level is at 1870 which is lighter support but probably enough for the S&P to break through 1900. I am still expecting that at some point in the spring to summer period stocks will correct down to the 1750 level. Yesterday I commented that the market direction looked poised to break out to new highs. That happened today. There is still enough strength at this point to push stocks beyond 1900 although in general volumes are not indicative of a strong rally either underway or in the works.
For Momentum I am using the 10 period. Momentum has been the best indicator over the past four months, replacing MACD as the most accurate indicator. Momentum moved higher today.
For MACD Histogram, I am using the Fast Points set at 13, Slow Points at 26 and Smoothing at 9. MACD (Moving Averages Convergence / Divergence) issued a buy signal on April 22. Today that signal continued to hold as MACD turned around from being on the verge of a sell signal and is signaling back up for stocks.
The Ultimate Oscillator settings are Period 1 is 5, Period 2 is 10, Period 3 is 15, Factor 1 is 4, Factor 2 is 2 and Factor 3 is 1. These are not the default settings but are the settings I use with the S&P 500 chart set for 1 to 3 months. The Ultimate Oscillator is continuing positive and rising toward being overbought.
Rate Of Change is set for a 21 period. The rate of change is still positive and took a big jump higher today.
For the Slow Stochastic I use the K period of 14 and D period of 3. The Slow Stochastic is signaling market direction is up and it is now overbought.
For the Fast Stochastic I use the K period of 20 and D period of 5. These are not default settings but settings I set for the 1 to 3 month S&P 500 chart when it is set for daily. The Fast Stochastic is also signaling market direction is up and it too is overbought.
Market Direction Outlook And Strategy for May 13 2014
The market direction technical indicators are all positive and all are climbing or signaling higher prices are ahead for stocks. The strength today may see a bit of weakness at the open on Tuesday but in general the trend is for stocks to still move higher.
A number of buy signals today on some of the more beaten up stocks like Twitter also helped to boost stocks higher. In general all indicators are still pointing to higher prices although investors are not pumping in a lot of new capital but instead trading with existing positions by rotating out of one sector and moving into another.
For Tuesday I will be looking for more Put Selling opportunities as I believe there is enough momentum up for most of this week. Apple stock in particular looks good and I did one credit put spread today and may be about ready to close a second trade. That would free up capital for further trades for out to May 30 options expiry which would allow my positions to be out by the time the stock split occurs on June 7.
Market Direction Internal Links
Profiting From Understanding Market Direction (Articles Index)
Understanding Short-Term Signals
Market Direction Portfolio Trades (Members)