The market direction outlook for Friday was for stocks to continue to advance but far weaker now as the market is over overbought. A pull back could start at any time now. Consumer spending slipped 0.1 percent in April marking a very small decline but still the first decline in a year. The decline though should be expected after a 1 percent rise in March which was the biggest gain since September 2009. Probably the most interesting piece of information on Friday was the contrast between Express and Guess stocks which slumped on their forecasts of poor profits for the upcoming quarter versus a 13% jump in closeout retailer Big Lots which trades under the symbol BIG on New York. With retailers under increasing pressure it was interesting to see the closeout retailer doing so well with profits versus the more established brands. It shows investors that consumers are remaining cautious with their income and be selective in their spending preferring discount outlets over the name brands. This fits in well with the 1% decline in GDP announced on Thursday and seems to offer evidence of the concern consumers still have.
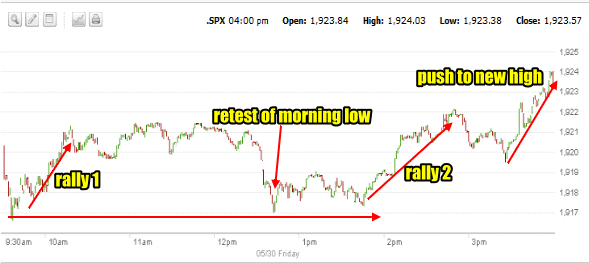
Market Direction S&P Intraday Chart May 30 2014
For Friday stocks continued to stay choppy. The day started with a short drop and then a rally back to around 1921. Over the lunch hour investors sold the market lower and stocks retested the morning opening low. The test held and shortly before 2:00 a second rally was entered into which shot up the S&P to 1922. Up just a point higher than the morning rally, investors continued the see-saw action only to buy back into the last half hour and shoot the S&P to another new closing high.

Advance Declines For May 30 2014
On Friday the number of new highs bounced was still at 202 and new lows were down at 71. While the new highs shows that investors remain bullish, only 49% of volume was up while 47% was down.Total volume on Friday was around 3.2 billion shares which was still below Monday’s level.
Market Direction Closings For May 30 2014
The S&P closed at 1923.57 up 3.54. The Dow closed at 16,717.17 up 18.43. The NASDAQ closed at 4242.62 down 5.33.
The IWM Russell small cap ETF was fell 51 cents or 0.45% to close down at $112.86
Market Direction Technical Indicators At The Close of May 30 2014
Let’s review the market direction technical indicators at the close of May 30 2014 on the S&P 500 and view the market direction outlook for June 2 2014.

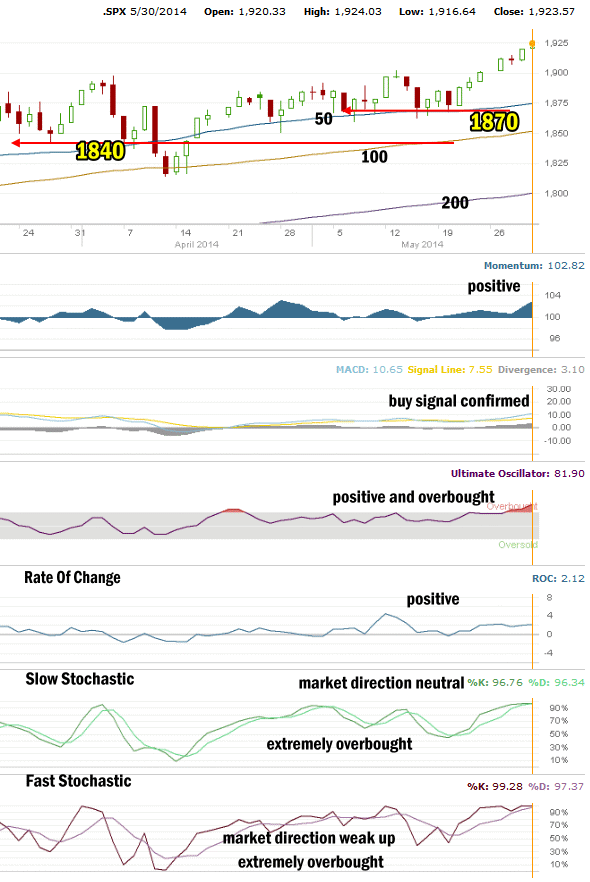
With the market continuing to break into new all-time highs, there are now four key support levels in the market. Long-term support is at 1750. If that level should break at this point, it would mean a significant correction would ensue. The second level of support is at 1775 which again is good support and if it broke would mean that the market direction would quickly collapse down to 1750. These two indicators are good values to use for longer-term trading. As long as stocks stay above these levels, there is no concern the markets will experience any kind of severe pullback.
The next two levels are at 1840 and 1870. At this point with the S&P above 1900, any pull back to 1870 would be a signal to pick up short instruments like the SDOW or SQQQ ETFs or spy put options. If 1870 were breached it would mean a further break lower to at least the 1840 level and for investors it would be a quick and easy trade to pick up short products to enjoy some profits down to 1840. If 1840 were to break at this point it would mean to roll any at the money puts lower and roll down covered calls but only if 1840 were to break. Between 1840 and 1775 there is very little to no support. At this point then, 1870 is actually more important than 1920 for those of us who sell puts for income. The market can wander all it wants but as long as it does not break 1870 then I will be taking advantage of any dips to continue put selling.
On Friday the S&P pushed to another new record but you can see in the chart above that the move up has no support and is over-extended. It will pull back either on Monday or certainly during the early part of the first week of June.
For Momentum I am using the 10 period. Momentum has been the best indicator over the past five months, replacing MACD as the most accurate indicator. Momentum is positive.
For MACD Histogram, I am using the Fast Points set at 13, Slow Points at 26 and Smoothing at 9. MACD (Moving Averages Convergence / Divergence) issued a buy signal on May 23. On Friday the buy signal continued to gain strength.
The Ultimate Oscillator settings are Period 1 is 5, Period 2 is 10, Period 3 is 15, Factor 1 is 4, Factor 2 is 2 and Factor 3 is 1. These are not the default settings but are the settings I use with the S&P 500 chart set for 1 to 3 months. The Ultimate Oscillator is continuing positive and remains overbought.
Rate Of Change is set for a 21 period. The rate of change remains positive but is largely moving sideways indicating buying pressure but very little new capital being used.
For the Slow Stochastic I use the K period of 14 and D period of 3. The Slow Stochastic is signaling market direction is now neutral and it is extremely overbought.
For the Fast Stochastic I use the K period of 20 and D period of 5. These are not default settings but settings I set for the 1 to 3 month S&P 500 chart when it is set for daily. The Fast Stochastic is signaling that the market direction up is weak and it too is extremely overbought.
Market Direction Outlook And Strategy for June 2 2014
There are many signals that the market direction up is weakening and preparing to fall back. The Slow Stochastic in particular is now neutral and the Fast Stochastic readings are narrow indicating a weak advance from this point forward.
June has a poor record for stocks. It is also the beginning of the worst months for the NASDAQ. In 2008 the S&P had the worst June since the 1930’s with a drop of 8.6%. But a lot of analysts believe June will see a stiff correction in stock valuations. The problem is too many analysts believe the correction will definitely happen in June and rarely are the majority correct. Still though at present there are a lot of indicators pointing to a very overbought market. Without any support the recent advance is bound to pull back to try to find support at lower valuations. At present, a decline much below 1870 is not being predicted but like always I have my strategy in place should 1870 be tested and break. That strategy is described above in the market direction technical analysis paragraphs.
Friday saw reasonably good volume but investors were almost evenly split in their directional trading. I was expecting the start of a pull-back on Friday. We could see a pull-back on Monday then. The push higher over the past week has left the market direction up, over-extended without support. This has set up the start of June to probably be a repeat performance of past June’s where the market direction commenced a correction.
Market Direction Internal Links
Profiting From Understanding Market Direction (Articles Index)
Understanding Short-Term Signals
Market Direction Portfolio Trades (Members)
