The best market timing system I know of has to be the Weekly Initial Unemployment Insurance Claims. I have written about this market timing system many times in the past. You can browse these articles on market timing and read up on the Weekly Initial Unemployment Insurance Claims strategy. Today the Weekly Initial Unemployment Insurance Claims were released and applications fell by 12,000 to 334,000. The four week average has now declined to 345,250. The Weekly Initial Unemployment Insurance Claims Strategy is that any time claims are below 350,000 the market will continue to move higher. You would be amazed at how often this strategy is right.
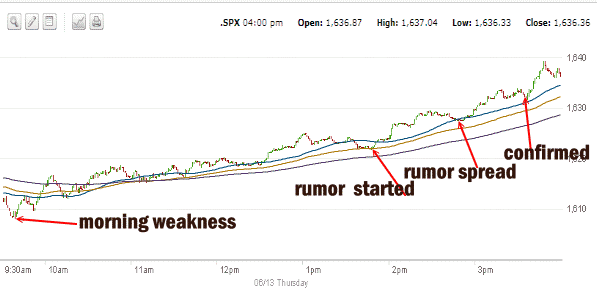
Add to this that the Commerce Department showed retails sales jumping to the highest level in 3 months and investors seemed ready to buy stocks at the open on Thursday. However the market direction was choppy at the open and if you look at today’s S&P 500 chart you can see that at the outset investors were a bit concerned and the market entered a short period of weakness. Indeed at one point the Dow was down about 40 points.
Market Direction Chart for June 13 2013
From there though the market recovered and then moved back to the pattern of higher highs and higher lows which as you know by now is indicative of a climbing market. Around 2;00 PM or so a rumor started to be heard about the Fed Chairman speaking about not stopping the Quantitative Easing program as early as this summer or possibly even September. The rumor spread and the market direction pushed higher. Into the close the rumor was confirmed that Bernanke would be speaking next week about how the scaling back of the present Quantitative Easing would take time and not happen “overnight”. Investors took this to mean that liquidity would be with the markets for longer than most realized and that Bernanke would not be letting stocks fall. The markets shot up on the news.

Investors are always a nervous bunch. The fear missing a rally and they fear being caught in a downturn. The fear of the Fed stopping the Quantitative Easing in one sudden move is not only unfounded but is also ridiculous to think would ever be the case. After years of Quantitative Easing it should be obvious to investors that an easing out of the Quantitative Easing strategy would have to be used. Nonetheless while that might be the reality, investors always need a lot of convincing and rumor is what drives stock markets which was obvious from today’s action.
Market Direction Closing For June 13 2013
The S&P 500 closed at 1,612.52 up 23.84 points. The Dow closed at 15,176.08 up 180.85 points. The NASDAQ closed at 3,445.36 up 44.93 points.
Market Direction Technical Indicators At The Close of June 13 2013
Let’s review the market direction technical indicators at the close of June 13 2013 on the S&P 500 and view the market direction outlook for June 14 2013.

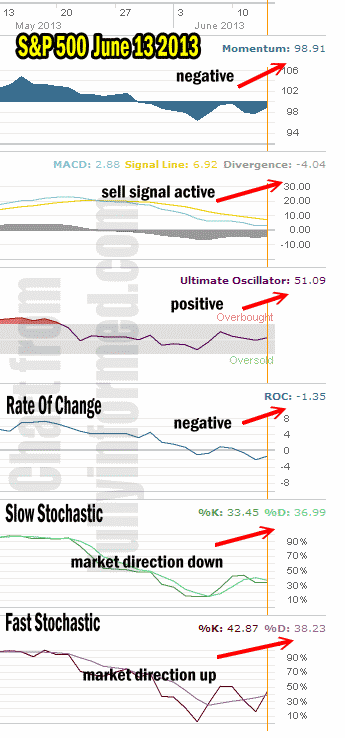
For Momentum I am using the 10 period. Momentum is still negative today and has now been negative since May 29. The push higher today did impact momentum but not enough to place it on the verge of turning positive. It will need another up day of some strength to turn positive.
For MACD Histogram I am using the Fast Points set at 13, Slow Points at 26 and Smoothing at 9. MACD (Moving Averages Convergence / Divergence) issued a sell signal on May 24. The sell signal is still valid and it remains with a wide divergence. The MACD signal is advising that investors should remain wary of the present market rally.
The Ultimate Oscillator settings are Period 1 is 5, Period 2 is 10, Period 3 is 15, Factor 1 is 4, Factor 2 is 2 and Factor 3 is 1. These are not the default settings but are the settings I use with the S&P 500 chart set for 1 to 3 months.
The Ultimate Oscillator is once more positive but the fact that it is just barely positive shows that the rally back today while strong, did not have enough strength to result in a large move into positive territory for the Ultimate Oscillator.
Rate Of Change is set for a 21 period. The rate of change is negative for the third day.
For the Slow Stochastic I use the K period of 14 and D period of 3. The Slow Stochastic is signaling that the market direction is lower despite today’s rally back up.
For the Fast Stochastic I use the K period of 20 and D period of 5. These are not default settings but settings I set for the 1 to 3 month S&P 500 chart when it is set for daily. The Fast Stochastic is signaling market direction is up and disagrees with the Slow Stochastic.
Market Direction Outlook And Strategy for June 14 2013
In my market direction outlook yesterday I indicated that “I expect the market direction will try to bounce, fail and then continue to move lower.” Today we had the bounce back which was both technical and political in nature. What we need to now see if a follow through action to the upside.
Even with today’s jump back off the 50 period moving average, I have written many times that the market direction needs a catalyst if it is to move a lot higher and challenge the most recent all time highs. You never know, Bernanke’s speech or even the hint that he will be speaking, may be enough to restore the market direction back up. Considering that it was Bernanke’s comments that created the correction we have had, it might seem fitting that he is the one to assist investors to regain confidence in the market direction.
The choppiness of the market is why I have stayed with options for so many years. I sell puts at strikes I think are fair value for stocks. If the markets should fall and I get assigned, I am happy to own the stocks and write covered calls or use other strategies to continue to generate income. On the other hand if the market turns around and marches higher, I am also happy as I have made a very good profit and was able to stay invested in the markets despite the market direction being unable to decide the next direction it will take.
For Friday I see a choppy session developing.
Market Direction Internal Links
Profiting From Understanding Market Direction (Articles Index)
Understanding Short-Term Signals
Market Direction Portfolio Trades (Members)
Market Direction External Links
