The market direction gap higher first thing in the morning can often come back to haunt a market as the gap open is often retested a few trading sessions later, so this morning’s gap open while nice to see, could be a sore point in upcoming days. It is always nicer to watch a market grind higher and investors watch it in disbelief. The best bull markets are those where investors complain they cannot get in to the rally and hope for a pullback soon. That’s among the best bull market indicators.
But that is not the market direction we are dealing with. Today’s market direction movement was as expected. The earnings from Alcoa were reasonably well received and the market reacted positively. Alcoa stock itself closed at $9.02, down 2 cents.
Market Direction Moves Today
The S&P 500 closed at 1461.02 up 3.87 points or 0.3 percent and the Dow closed at 13,390.51 up 61.66 points or 0.5 per cent.
None of the indexes closed on their highs for the day. Let’s see what the market direction technical indicators signaled at the close of the day.
Market Direction Technical Indicators Of Jan 9 2013

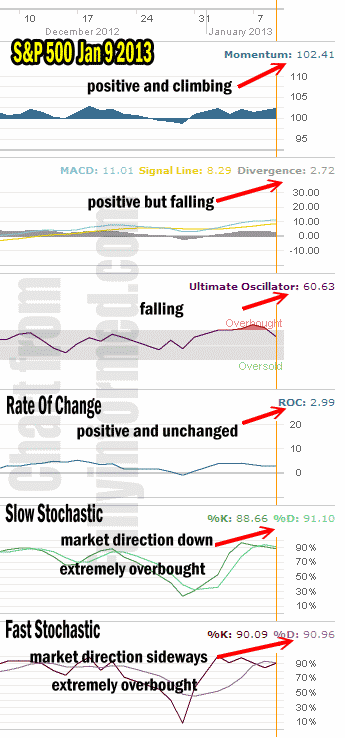
market direction technical outlook Jan 9 2013
For Momentum I am using the 10 period. Momentum is still positive and climbing higher.
For MACD Histogram I am using the Fast Points set at 13, Slow Points at 26 and Smoothing at 9. MACD (Moving Averages Convergence / Divergence) is still positive but continued to move lower today despite the rally.
The Ultimate Oscillator settings are Period 1 is 5, Period 2 is 10, Period 3 is 15, Factor 1 is 4, Factor 2 is 2 and Factor 3 is 1. These are not the default settings but are the settings I use with the S&P 500 chart set for 1 to 3 months.
The Ultimate Oscillator is still positive but is no longer overbought and is trending down.
Rate Of Change is set for a 21 period. Rate Of Change is still positive and up slightly from yesterday but in general it is unchanged.
For the Slow Stochastic I use the K period of 14 and D period of 3. The Slow Stochastic is overbought and continues to point to a market direction move lower despite today’s move higher.
For the Fast Stochastic I use the K period of 20 and D period of 5. These are not default settings but settings I set for the 1 to 3 month S&P 500 chart when it is set for daily. The Fast Stochastic is also overbought and is indicating a sideways day for tomorrow, Thursday.
Market Direction Outlook And Strategy
The market direction outlook for Thursday January 10 is for the market to move more sideways than up or down as the market direction higher remains under some pressure. The market direction technical indicators are not showing confidence among investors. A lot cannot be read into the movement today by the Ultimate Oscillator although it is signaling weakness in today’s action. It will take another day of market direction up to get MACD to turn higher as it signals that market direction weakness is still in the day’s rally.
The Fast Stochastic is perhaps the most telling with a clear sideways signal, while the slow stochastic is advising that today’s move higher may not last. The only market direction technical indicator that is solidly bullish is momentum which through the past couple of days has remained strongly bullish.
So today’s market direction outlook is a mixed bag as it were. The rally didn’t impress any of the market direction technical indicators except momentum. Reading all the market direction technical indicators and taking a consensus, they point to a sideways movement with a bias higher rather than lower which is mostly likely what Thursday will bring.
Internal Market Direction Links
