Unfortunately this evening I had a close friend and fellow investor pass away. I have returned home rather late. The market direction outlook for both the SPX and the TSX will be shorter than usual. I will resume my full outlines tomorrow.
Advance Declines For Dec 8 2014
Volume on Monday rose by about 400 million shares to 3.8 billion. Volume was definitely slanted toward the downside with 78% of all trades moving lower. Declining issues far outweighed advancing issues. New highs came is at 227 and new lows at 295. We need to see new lows back to below 30 to see an advance continue. While the actual index numbers don’t reflect large downside action, the number of new lows do.
Market Direction Closings For Dec 8 2014
The S&P closed at 2060.31 down 15.06 which is less than 1%. The Dow closed at 17,852.48 down 106.31 which is 0.59% loss. The NASDAQ closed at 4740.69 down 40.06 which is a loss of 0.84%.
Market Direction Technical Indicators At The Close of Dec 8 2014
Let’s review the market direction technical indicators at the close of Dec 8 2014 on the S&P 500 and view the market direction outlook for Dec 9 2014.

Market Direction Technical Analysis for Dec 8 2014
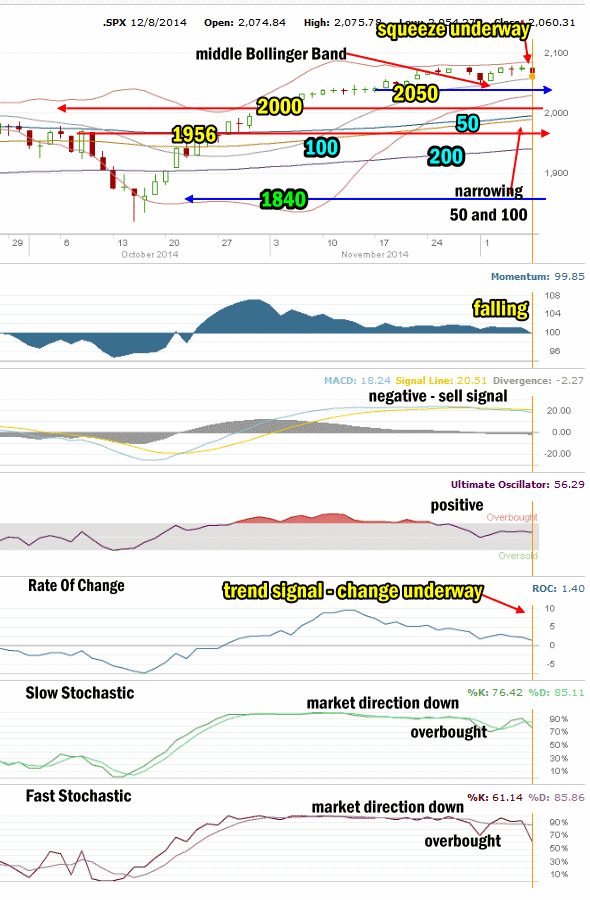
Stock Chart Comments: The chart is showing distinct pressure building to the downside. The SPX is back to the Middle Bollinger Band and the Bollinger Bands Squeeze OS taking shape with the candlesticks appearing ready to move lower. This squeeze appears intent on pushing the market lower. Remember 2050 is very light support. It will break fairly easy and the market will fall quickly to 2000 once 2050 breaks. The 50 and 100 day moving averages continue to narrow but are still not showing signals the 100 will cross up and over the 50.
The support level at 2050 is light support and will not delay a fall for more than a few hours. 2000 is the highest level of decent support at present and while not strong, it should have enough strength to hold sellers back for at least a day in the event of an interim pullback. If 2050 should break, stocks will collapse back to 2000 in very quick order. The next level after 2000 is at 1970 and then 1956.
Strong Support Levels are at 1870 and 1840. Both levels are strong enough to delay the market falling.
The other two support levels not shown in the chart above are 1775 and 1750. I have explained that these two are critical support for the present bull market. While 1775 is important it is 1750 that is now the bottom line.
A break of 1750 would mark a severe correction of more than 13% from the most recent high. This would be the biggest correction since April 2012. A pull-back of that size would definitely stun investors at this point and it is not something I am anticipating at this time.
Momentum: For Momentum I am using the 10 period. Momentum is negative and falling.
MACD Histogram: For MACD Histogram, I am using the Fast Points set at 13, Slow Points at 26 and Smoothing at 9. MACD (Moving Averages Convergence / Divergence) issued a sell signal on Dec 1. MACD continues negative.
Ultimate Oscillator: The Ultimate Oscillator settings are: Period 1 is 5, Period 2 is 10, Period 3 is 15, Factor 1 is 4, Factor 2 is 2 and Factor 3 is 1. These are not the default settings but are the settings I use with the S&P 500 chart set for 1 to 3 months. The Ultimate Oscillator remained positive today which was surprising..
Rate of Change: Rate Of Change is set for a 21 period. The Rate Of Change is moving lower indicating the trend change is now underway.
Slow Stochastic: For the Slow Stochastic I use the K period of 14 and D period of 3. The Slow Stochastic tries to predict the market direction further out than just one day. The Slow Stochastic is signaling market direction is down and issued a sell signal at the close today. It is overbought.
Fast Stochastic: For the Fast Stochastic I use the K period of 20 and D period of 5. These are not default settings but settings I set for the 1 to 3 month S&P 500 chart when it is set for daily. The Fast Stochastic is signaling down for stocks, also issued a sell signal and is also overbought.
Market Direction Outlook and Strategy for Dec 9 2014
My cautious stance certainly paid dividends today both with the market direction portfolio and many stock positions. The outlook for Tuesday is for a bounce attempt but still lower valuations for stocks. The biggest problem facing the SPX is the lack of support at 2050. Remember though that this type of action with dips in trading is necessary to build stronger support levels. Tomorrow will be interesting to see how low the close is. A smaller low would indicate more selling to come. A bigger low should set up a bounce.
Stay FullyInformed With Email Updates
Market Direction Internal Links
Profiting From Understanding Market Direction (Articles Index)
Understanding Short-Term Signals
Market Direction Portfolio Trades (Members)
