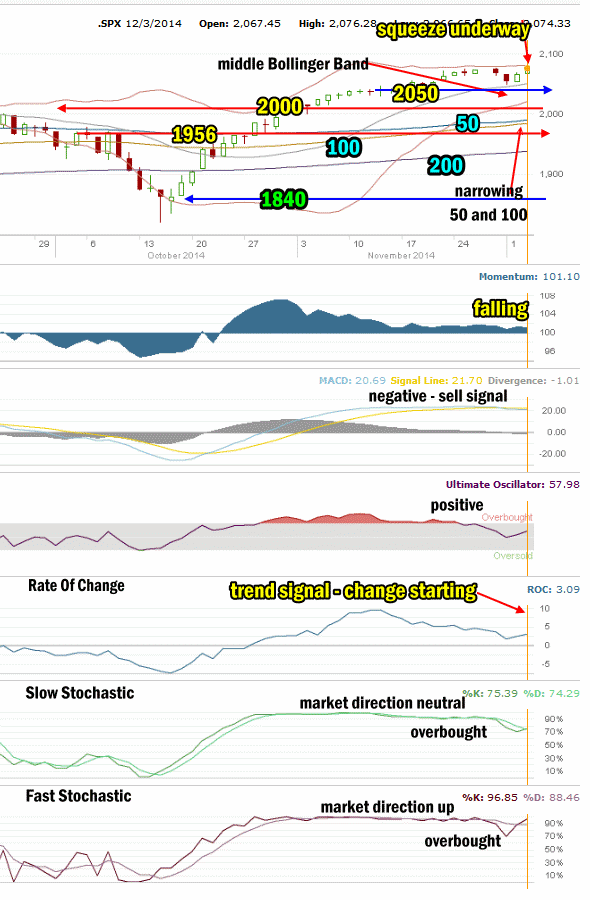
The outlook for stocks for Wednesday Dec 4 2014 was for stocks to be mixed but keep a bias to the upside. Yesterday MACD confirmed a sell signal on the S&P but the outlook still remained to the upside despite the signal. The sell signal is causing some pressure but stocks managed to modestly advance today and both the S&P and Dow set new all-time records. A growing number of analysts are becoming bearish on stocks citing a variety of factors leading them to become more bearish. I am still on the bullish side but that does not mean we will not see periods of weakness.
Advance Declines For Dec 3 2014
Volume on Wednesday matched yesterday’s volume at 3.6 billion shares but up volume far outweighed down volume with 70% of shares traded to the upside. There were 175 new highs and 74 new lows.
Market Direction Closings For Dec 3 2014
The S&P closed at 2074.33 up 7.78. The Dow closed at 17,912.62 up 33.07. The NASDAQ closed at 4774.47 up 18.66
Market Direction Technical Indicators At The Close of Dec 3 2014
Let’s review the market direction technical indicators at the close of Dec 3 2014 on the S&P 500 and view the market direction outlook for Dec 4 2014.

Market Direction Technical Analysis for Dec 3 2014
Stock Chart Comments: Stocks continued to climb today but despite the volume up being at 70% the number of new lows remains high indicating some pressure to the downside remains. The same issues as yesterday still exist. The 50 day SMA is trending on top of the 100 day and could cross lower. The 20 day SMA is trending higher and stocks are still staying above it, which is a good signal.
The support level at 2050 is light support and will not delay a fall for more than a few hours. 2000 is the highest level of decent support at present and while not strong, it should have enough strength to hold sellers back for at least a day in the event of an interim pullback. If 2050 should break, stocks will collapse back to 2000 in very quick order. The next level after 2000 is at 1970 and then 1956.
Strong Support Levels are at 1870 and 1840. Both levels are strong enough to delay the market falling.
The other two support levels not shown in the chart above are 1775 and 1750. I have explained that these two are critical support for the present bull market. While 1775 is important it is 1750 that is now the bottom line.
A break of 1750 would mark a severe correction of more than 13% from the most recent high. This would be the biggest correction since April 2012. A pull-back of that size would definitely stun investors at this point and it is not something I am anticipating at this time.
Momentum: For Momentum I am using the 10 period. Momentum is positive and moving lower.
MACD Histogram: For MACD Histogram, I am using the Fast Points set at 13, Slow Points at 26 and Smoothing at 9. MACD (Moving Averages Convergence / Divergence) issued a sell signal on Dec 1. MACD continues negative.
Ultimate Oscillator: The Ultimate Oscillator settings are: Period 1 is 5, Period 2 is 10, Period 3 is 15, Factor 1 is 4, Factor 2 is 2 and Factor 3 is 1. These are not the default settings but are the settings I use with the S&P 500 chart set for 1 to 3 months. The Ultimate Oscillator has jumped back to positive.
Rate of Change: Rate Of Change is set for a 21 period. The Rate Of Change is moving sideways and still indicating a change in the trend is underway.
Slow Stochastic: For the Slow Stochastic I use the K period of 14 and D period of 3. The Slow Stochastic tries to predict the market direction further out than just one day. The Slow Stochastic is signaling market direction is neutral.
Fast Stochastic: For the Fast Stochastic I use the K period of 20 and D period of 5. These are not default settings but settings I set for the 1 to 3 month S&P 500 chart when it is set for daily. The Fast Stochastic is signaling up for stocks and is also overbought.
Market Direction Outlook and Strategy for Dec 4 2014
Technically for Thursday Dec 4 2014, stocks should remain mixed. The technical indicators are somewhat undecided as a group but individually there are two pointing lower, two neutral and two pointing higher, a true mixed outlook.
Thursday we get the Weekly Initial Unemployment Insurance Claims which can sometimes move the market. Overall though I am expecting a slightly higher close again on Thursday.
Stay FullyInformed With Email Updates
Market Direction Internal Links
Profiting From Understanding Market Direction (Articles Index)
Understanding Short-Term Signals
Market Direction Portfolio Trades (Members)
