
Monday was a wild day as I’m sure all investors are aware so there isn’t much point in covering the wild swings the market experienced. Much of the decline can be blamed on the collapse of the Shanghai Composite Index on Monday which was down over 8%. This evening as China’s stock market traded it opened down 6.4 percent but then rebounded slightly and at the time of my writing this Market Direction Outlook the Shanghai Composite Index is down 6%.
While other Asian stock markets were either flat, down slightly or up slightly, the outlook for North American markets to start the day is a bounce which is reflected in the futures this evening. But the chance that the selling is over I think is far too premature.
Advance Decline Numbers for Aug 24 2015
Total volume across all the US exchanges was over 14 billion shares traded with much of the action coming at the start of the day and in the last hour. The daily average this year has been around 6.6 billion so this marks slightly more than double the usual number of shares traded. Perhaps surprisingly Monday was not the heaviest day traded so far this year. It was June 26. Of the volume traded 91% of all trades were to the downside. 95% of all stocks on New York were declining. In total 1,230 stocks made new 52 week lows while just 3 made new highs. Basically almost one third of all listed stocks on New York made new lows on Monday.
Market Direction Technical Indicators At The Close of Aug 24 2015
Let’s review the market direction technical indicators at the close of Aug 24 2015 on the S&P 500 and view the market direction outlook for Aug 25 2015.
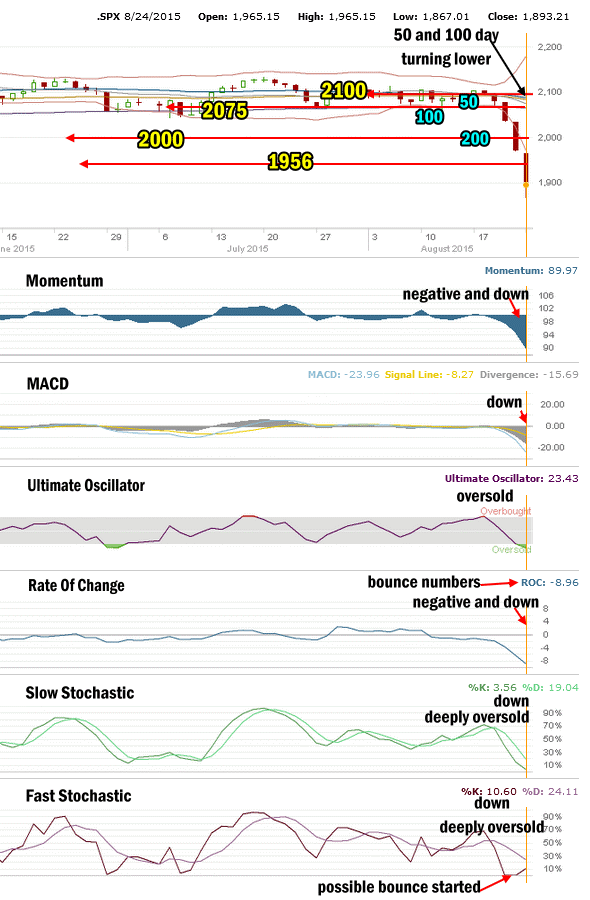
SPX Market Direction Technical Analysis for Aug 24 2015
Stock Chart Comments:
The index collapsed right at the open and set the low for the day. This was the same with all three major indexes. The S&P closed off the lows for the day but well below strong support at 1956 and below 1900. During the early collapse the index blew through 1870 which is strong support for the market. This may push the market back up and keep the market at 1870 for Tuesday. Determined selling though will break any support valuation.
Meanwhile the 20 day simple moving average (SMA) continues to fall quickly toward the 200 day moving average. The 50 day moving average meanwhile has not yet broken below the 100 day moving average. The could happen on Tuesday if the market continues to decline.
Support and Resistance Levels:
These are the present support and resistance levels.
2100 was light support. Stocks have been unable to stay above this level and push higher.
2075 was light support. Below that was 2050 which is also was light support. Stronger support was at 2000 which has repeatedly held the market up throughout each pullback in January and February but failed under the waves of selling on Friday.
Weak support was at 1970 while stronger support was at 1956 and technically it is more important than 1970 for the market.
1870 and 1840 are both levels with strong enough support to delay the market falling and should see a sideways action attempt while investors decide whether to sell or buy.
The other two support levels are 1775 and 1750. I have explained that these two are critical support for the present bull market. While 1775 is important it is 1750 that is the bottom line.
A break of 1750 would mark a severe correction of 384.72 points or 18% from the all-time high of 2134.72. This would be the biggest correction since April 2012. A pull-back of that size would definitely stun investors and bring to question whether the bull market is finished.
Momentum: Momentum is negative and falling rapidly. Momentum is at the worst reading since September 2011 as investors in general seem to believe this is the end of the present bull market which started in 2009.
MACD Histogram: For MACD Histogram, I am using the Fast Points set at 13, Slow Points at 26 and Smoothing at 9. MACD (Moving Averages Convergence / Divergence) issued a sell signal on Aug 19. That sell signal gained strength again on Monday.
Ultimate Oscillator: The Ultimate Oscillator settings are: Period 1 is 5, Period 2 is 10, Period 3 is 15, Factor 1 is 4, Factor 2 is 2 and Factor 3 is 1. These are not the default settings but are the settings I use with the S&P 500 chart set for 1 to 3 months. The Ultimate Oscillator is negative and deeply oversold. These kinds of readings normally have a bounce.
Rate of Change: Rate Of Change is set for a 21 period. The rate of change signal remains negative and is moving into a strong negative numbers that are often associated with bounce backs.
Slow Stochastic: For the Slow Stochastic I use the K period of 14 and D period of 3. The Slow Stochastic tries to predict the market direction further out than just one day. The Slow Stochastic is pointing down for stocks and is deeply oversold to the point where usually the market will bounce.
Fast Stochastic: For the Fast Stochastic I use the K period of 20 and D period of 5. These are not default settings but settings I set for the 1 to 3 month S&P 500 chart when it is set for daily. The Fast Stochastic is pointing down for stocks and is deeply oversold. You can see in the chart that the Fast Stochastic has turned up trying to signal a bounce is in the works for stocks.
Market Direction Outlook for August 25 2015
Monday was brutal for stocks with the NASDAQ having its worst day since November 2008 and the S&P and Dow having its worst day since May 2010’s flash crash. Selling was intense at times and there were definite signs of panic. Whether capitulation of selling was in the air is, I think, doubtful at this early stage of the collapse.
For Tuesday all indicators are pointing to a fairly strong rebound rally which will be followed by more selling. I doubt this correction is over and believe lots more downside lies ahead.
Stay FullyInformed With Email Updates
Market Direction Internal Links
Profiting From Understanding Market Direction (Articles Index)
Understanding Short-Term Signals
Market Direction Portfolio Trades (Members)