Tuesday’s markets were mixed with the Dow up 59.66 points, the S&P up just 3.41 points and the NASDAQ down 10.96. But despite the lackluster performance volume was actually up and new lows still point to this present weakness as just consolidation. Let’s take a look at Tuesday’s performance and Wednesday’s outlook.
Advance Decline for Apr 14 2015
Volume on Tuesday picked up 400 million shares to 3.3 billion. Up volume was at 68% and down volume 31%. New highs were lower at 71 but new lows hardly budged at just 8. So far, this period of weakness looks like testing for support and consolidation of recent gains and not much else. The new lows have to increase if there is to be any kind of meaningful pullback. At present that does not appear to be the case.
Market Direction Closings For Apr 14 2015
The S&P closed at 2095.84 up 3.41. The Dow closed at 18,036.70 up 59.66. The NASDAQ closed at 4,977.29 up 10.96.
Market Direction Technical Indicators At The Close of Apr 14 2015
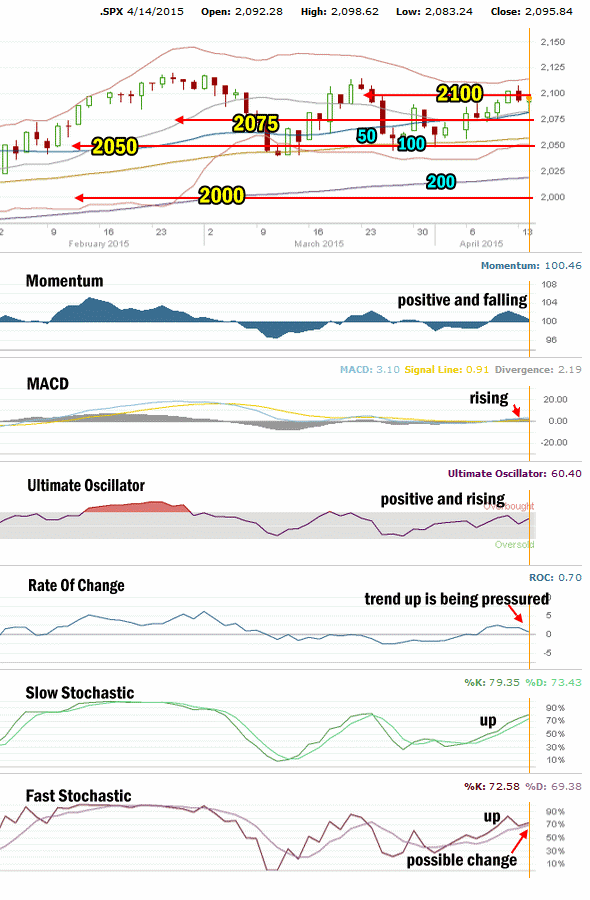
Let’s review the market direction technical indicators at the close of Apr 14 2015 on the S&P 500 and view the market direction outlook for Apr 15 2015.

Market Direction Technical Analysis for Apr 14 2015
Stock Chart Comments:
The most significant event today was the S&P closing back below the 2100 level for the second day. Today though volume picked up other the number of puts being sold on the market itself swamped calls. For the contrarian, this indicates the market may move higher shortly. For the crowd followers, the bet by most traders is the S&P will pullback further.
Support and Resistance Levels:
These are the present support and resistance levels.
2100 was very light support and is now resistance. Stocks will have to stay above it to change it back to support.
2075 is light support. Below that is 2050 which is also light support. Stronger support is at 2000 which has repeatedly held the market up throughout each pullback in January and February.
Weak support is at 1970. Stronger support is at 1956.
1870 and 1840 are both levels with strong enough support to delay the market falling and should see a sideways action attempt while investors decide whether to sell or buy.
The other two support levels are 1775 and 1750. I have explained that these two are critical support for the present bull market. While 1775 is important it is 1750 that is the bottom line.
A break of 1750 would mark a severe correction from the most recent high. This would be the biggest correction since April 2012. A pull-back of that size would definitely stun investors and bring to question whether the bull market is finished.
Momentum: For Momentum I am using the 10 period. Momentum is positive but falling. One more down day and it will be negative.
MACD Histogram: For MACD Histogram, I am using the Fast Points set at 13, Slow Points at 26 and Smoothing at 9. MACD (Moving Averages Convergence / Divergence) issued a buy signal on Apr 9 and that signal rose again today although only slightly.
Ultimate Oscillator: The Ultimate Oscillator settings are: Period 1 is 5, Period 2 is 10, Period 3 is 15, Factor 1 is 4, Factor 2 is 2 and Factor 3 is 1. These are not the default settings but are the settings I use with the S&P 500 chart set for 1 to 3 months. The Ultimate Oscillator is positive and after Monday’s tumble it turned back up today.
Rate of Change: Rate Of Change is set for a 21 period. The Rate Of Change is turning lower indicating that the up move and to a lesser extent the sideways move are both under pressure
Slow Stochastic: For the Slow Stochastic I use the K period of 14 and D period of 3. The Slow Stochastic tries to predict the market direction further out than just one day. The slow stochastic is still pointing up for stocks.
Fast Stochastic: For the Fast Stochastic I use the K period of 20 and D period of 5. These are not default settings but settings I set for the 1 to 3 month S&P 500 chart when it is set for daily. The Fast Stochastic is also pointing up but once again it is on the verge of a sell signal if there is more selling on Wednesday.
Market Direction Outlook for Apr 15 2015
The technical indicators are still pointing higher but there are signals that pressure is building to the downside. While technically the outlook is still up, MACD is not moving higher quick enough and momentum, rate of change and the Fast Stochastic are all on the verge of sell signals.
Still though, the S&P is barely below 2100 and with earnings like Intel’s out of the way on Tuesday after the close, markets may try to move up. Intel’s earnings were better than expected as they managed to meet estimates although they have deeply cut their capital spending. This definitely points to weakness in their market. While after hours the stock bounced a full $1.00, we may see a lot of that given back on Wednesday.
For Wednesday then, stocks look set to move lower at the open and then pick up the pace and try to get back above the 2100 level. With a lot of pressure building for stocks to move lower, the index needs to get going back above 2100. Otherwise stocks will moved down to 2075 quickly. Wednesday is a key day for stocks. With two days of consolidation probably not enough to confirm support at 2100, pressures are too strong to the downside to be ignored further by traders.
Stay FullyInformed With Email Updates
Market Direction Internal Links
Profiting From Understanding Market Direction (Articles Index)
Understanding Short-Term Signals
Market Direction Portfolio Trades (Members)
