The market direction outlook for Thursday was for stocks to remain unchanged depending on the Weekly Initial Unemployment Insurance Claims. These claims came in lower than expected which seemed to boost investor enthusiasm. There was also the belief that the sharp dip on Wednesday morning was a retest of Monday’s low and some analysts called that dip, the end of the correction. This could be true if the unemployment numbers on Friday come in stronger than expected. Overall though the rise in the US dollar seems to have slowed and sellers in general seemed tired after Monday’s big drop.
Market Direction Dow Chart
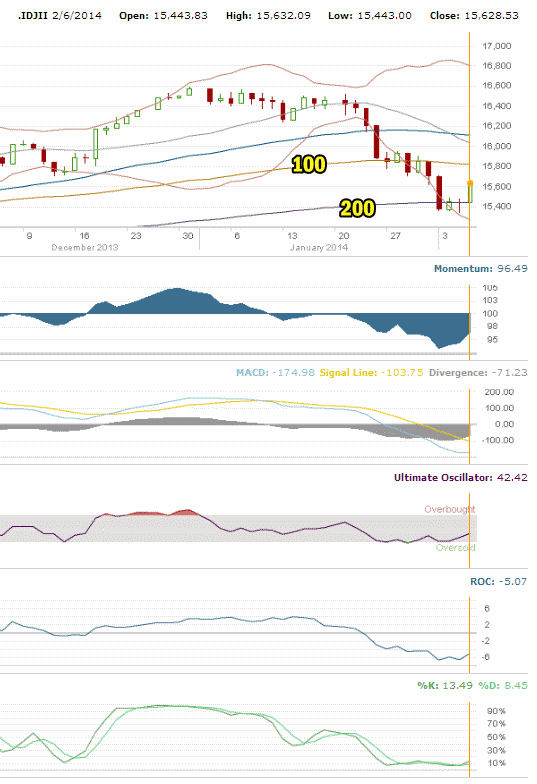
The Intraday chart for the S&P was non-eventful today as the market moved higher at the open and stayed higher into the close. The S&P closed near the highs for the day. Instead I want to look at the Dow chart as the Dow pushed back above the 200 day exponential moving average (EMA) today. The Dow closed well above the 200 day moving average after attempting twice to recapture this important moving average. The technical chart below shows that momentum is moving back higher for the third day. MACD is very oversold still. The Ultimate oscillator is also still very oversold. Rate of change has a very negative 5.07 which almost always signals a change in trend and this looks like it could be back higher. The slow stochastic gave a buy signal at the close of today.
All of these point to a recovery effort but poor employment news could end this. If the news is good though, stocks should rally hard.

Advance Declines For Feb 6 2014
The advance decline ratio strongly bullish with 73% of stocks advancing and 24% declining. There were just 51 new highs the new lows really fell off with just 93. Momentum is now shifting back to a move higher.
Market Direction Closings For Feb 6 2014
The S&P closed at 1773.43 up 21.79. The Dow closed at 15,628.53 up 188.30. The NASDAQ closed at 4057.12 up 45.57.
The IWM ETF closed up .86 cents to 109.51
Market Direction Technical Indicators At The Close of Feb 6 2014
Let’s review the market direction technical indicators at the close of Feb 6 2014 on the S&P 500 and view the market direction outlook for Feb 7 2014.

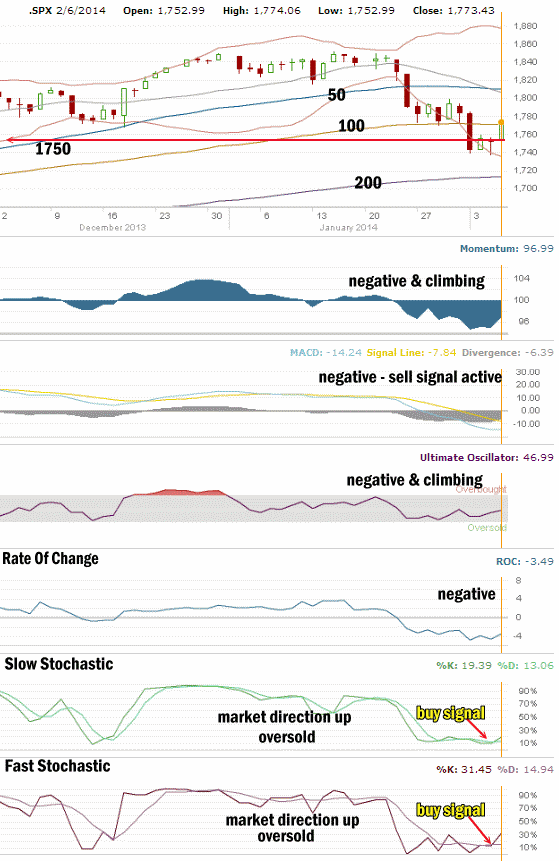
The 1750 level is back holding the S&P up. Investors have done a good job of pushing this market back above 1750. The close today at 1773.43 places the market back within striking distance of 1780 and then 1800. This is a good sign and it will take a poor jobs number to push this market back down at present.
For Momentum I am using the 10 period. Momentum has been the best indicator over the past two months, replacing MACD as the most accurate indicator. Momentum remains strongly negative but is climbing quickly now.
For MACD Histogram I am using the Fast Points set at 13, Slow Points at 26 and Smoothing at 9. MACD (Moving Averages Convergence / Divergence) issued a sell signal on Jan 8 2014 which was confirmed on Jan 9. MACD refused to turn positive since Jan 8. MACD remained strongly negative today but it took a big jump higher from the past few days where readings were over negative 8.
The Ultimate Oscillator settings are Period 1 is 5, Period 2 is 10, Period 3 is 15, Factor 1 is 4, Factor 2 is 2 and Factor 3 is 1. These are not the default settings but are the settings I use with the S&P 500 chart set for 1 to 3 months.
The Ultimate Oscillator is negative but is also back rising..
Rate Of Change is set for a 21 period. The rate of change is still negative and back rising. Investors are showing some interest in stocks although not a lot of new money is coming in. Instead we are seeing a lot of trading.
For the Slow Stochastic I use the K period of 14 and D period of 3. The Slow Stochastic is signaling that the market direction is up and it issued a buy signal today.
For the Fast Stochastic I use the K period of 20 and D period of 5. These are not default settings but settings I set for the 1 to 3 month S&P 500 chart when it is set for daily. The Fast Stochastic is indicating that the market direction is up for the second day and it also issued a buy signal which helps to confirm the buy signal from the Slow Stochastic.
Market Direction Outlook And Strategy for Feb 7 2014
It really is all about the jobs numbers. If they are decent, the market will rally hard and probably swiftly at the open. I would not expect a negative close at all with decent jobs numbers. If the numbers are mediocre I would expect weakness and a possible slightly negative close although with the above indicators showing strength returning to the upside, I would expect even a mediocre number will not damage the upward momentum by much.
Poor jobs numbers on the other hand will drag the market lower. As long as the S&P 500 does not break 1750 though the trend higher will return.
At present then it all depends on the jobs numbers. If the Weekly Initial Unemployment Insurance Claims are to be followed, the jobs numbers should be slightly positive but closer to mediocre. Still I would expect the December number will be adjusted higher. It should be an exciting day on Friday.
Market Direction Internal Links
Profiting From Understanding Market Direction (Articles Index)
Understanding Short-Term Signals
Market Direction Portfolio Trades (Members)
Market Direction External Links
Market Direction IWM ETF Russell 2000 Fund Info
Market Direction SPY ETF 500 Fund Info
