I think just about every investor knew that market direction had to shift. The market direction up has been so overbought that it only needed a reason to get investors to sell stocks and lock in some profits. Market Direction today ended up pretty much as expected although I had no way of knowing whether to markets would end on the lows of the day, which they did.
Market Direction Closings
Here are the market direction closing numbers for Feb 4 2013.

market direction closings Feb 4 2013
Market Direction Technical Indicators of Jan 14 2013
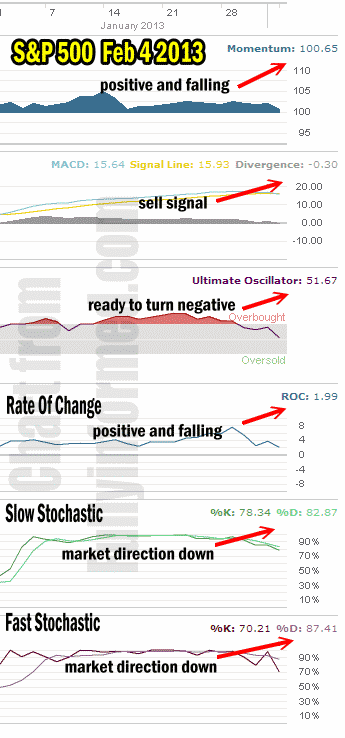
Let’s take a moment now and review the market direction technical indicators at the close of Feb 4 2013 on the S&P 500 to see the outlook for Feb 5 2013.

market direction - Feb 4 2013
For Momentum I am using the 10 period. Momentum is still positive but it is falling rapidly.
For MACD Histogram I am using the Fast Points set at 13, Slow Points at 26 and Smoothing at 9. MACD (Moving Averages Convergence / Divergence) issued a sell signal on the S&P 500 today at the close indicating market direction has shifted to down.
The Ultimate Oscillator settings are Period 1 is 5, Period 2 is 10, Period 3 is 15, Factor 1 is 4, Factor 2 is 2 and Factor 3 is 1. These are not the default settings but are the settings I use with the S&P 500 chart set for 1 to 3 months.
The Ultimate Oscillator is still positive but has fallen to the point where if tomorrow is down it too will issue a sell signal.
Rate Of Change is set for a 21 period. Rate Of Change is still positive but today’s selling turned rate of change sharply lower.
For the Slow Stochastic I use the K period of 14 and D period of 3. The Slow Stochastic is no longer overbought. It is signaling that the market direction is lower. As it looks out more than a day or two, the Slow Stochastic is warning investors that the stock market will be lower later in the week.
For the Fast Stochastic I use the K period of 20 and D period of 5. These are not default settings but settings I set for the 1 to 3 month S&P 500 chart when it is set for daily. The Fast Stochastic is also no longer oversold and it is signaling that the market direction is lower heading into tomorrow. The readings with D at 87 and k at 70 are wide enough that selling may be more pronounced on Tuesday than investors are expecting.
Market Direction Outlook And Strategy
The market direction outlook for Tuesday then is for the downturn to continue. The consensus among the market direction technical indicators is for the S&P 500 to move lower as we move into this week. Remember that February is the weakest of the 6 best months of the year for stocks. I won’t be surprised to see the S&P 500 lose 50 to 75 points before this correction ends.
There is no reason to rush into Put Selling but instead I plan to scale into positions by starting with a handful of Put Selling contracts and then increase them if the selling intensifies and pushes market direction and my favorite stocks lower.
Internal Market Direction Links
Profiting From Understanding Market Direction (Articles Index)
Understanding Short-Term Signals
Market Direction Candlestick Daily View (Members only)
Market Direction Portfolio Ongoing Trades (Members only)
