My market direction outlook for Friday was for the market direction to move lower if the unemployment numbers were poor and for market direction to have a bounce if the numbers were decent. If the market bounced I indicated I would be selling covered calls on longer-term stocks as I believed the push higher based on unemployment numbers would be short-lived in February. I went on to say that the market direction technical indicators were such that I would not be surprised to see a 4% or 5% correction in February before entering into March.
Friday’s market direction move higher on all the indexes was compelling but I am not ready yet to move aside with my outlook that we could see a bit more upside before the market stalls and decides to retest support.
Market Direction Closings
The S&P 500 closed at 1513.17, up 15.06 points and the Dow closed at 14,009.79, up 149.21 points. The NASDAQ closed at 3179.10 up 36.97.
Market Direction Technical Indicators at the close Feb 1 2013
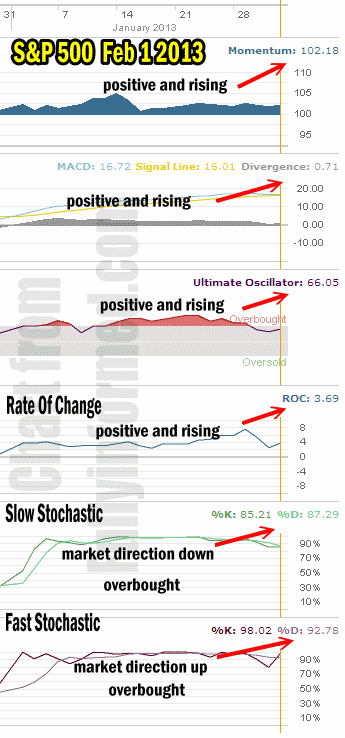
Let’s take a moment now and review the market direction technical indicators at the close of Feb 1 2013 on the S&P 500 to see the outlook for Feb 4 2013.

Market Direction Technical Indicators Feb 1 2013
For Momentum I am using the 10 period. Momentum is positive and back rising a bullish signal for the S&P 500 but still momentum is not as strong as it was in mid January as many investors still remain cautious.
For MACD Histogram I am using the Fast Points set at 13, Slow Points at 26 and Smoothing at 9. MACD (Moving Averages Convergence / Divergence) is still positive and pulled back up higher on Friday but overall the move higher remains unimpressive at this point. The market direction needs more follow through to convince MACD that the move can still continue higher.
The Ultimate Oscillator settings are Period 1 is 5, Period 2 is 10, Period 3 is 15, Factor 1 is 4, Factor 2 is 2 and Factor 3 is 1. These are not the default settings but are the settings I use with the S&P 500 chart set for 1 to 3 months.
The Ultimate Oscillator is higher on Friday than on Thursday, indicating the market direction remains higher.
Rate Of Change is set for a 21 period. Rate Of Change had a nice bounce back but it was a shallow move up, perhaps brought about by the sharp open in the S&P and then the sideways motion once the market set its high.
For the Slow Stochastic I use the K period of 14 and D period of 3. The Slow Stochastic is overbought and despite the jump on Friday it is still signaling market direction will be lower within a couple of days or later in the week.
For the Fast Stochastic I use the K period of 20 and D period of 5. These are not default settings but settings I set for the 1 to 3 month S&P 500 chart when it is set for daily. The Fast Stochastic is also overbought but it disagrees with the slow stochastic and indicates Monday will see the market direction push higher.
Market Direction Outlook And Strategy For Feb 4 2013
The market direction outlook for Monday is a mixed bag. The general consensus is for stocks to remain strong but stocks need to see a strong follow through on Monday to turn MACD solidly back up and get the Slow Stochastic to signal that market direction will be higher. Despite the market move higher on Friday, the push due to the unemployment numbers may be weaker than a lot of investors suspect.
Nonetheless the market direction remains higher with cautionary flags appearing. This is why combining options with stocks is such a good idea. This buys a bit of protection and still allows an investor to profit from the market direction staying up. Remaining cautious is always warranted when it comes to stocks, especially when the present rally is showing poor signs of momentum, a slipping MACD and a slow stochastic that keeps warning that stocks will move lower.
Internal Market Direction Links
Profiting From Understanding Market Direction (Articles Index)
Understanding Short-Term Signals
Market Direction Candlestick Daily View (Members only)
Market Direction Portfolio Ongoing Trades (Members only)
