The Market Direction outlook for Thursday was basically the market direction to stay primarily sideways and keep a bias to the downside. Instead today investors at first were surprised by the rise in the Weekly Initial Unemployment Insurance Claims and then shrugged it off as being just due to the weather. Concerns over China slowing were cast aside and the problems in the Ukraine were seen as a non-issue at present. Instead the focus was on Janet Yellen’s testimony in the Senate in which she basically assured Senators and investors alike that the Fed stands ready with liquidity to ward off any crisis and she mentioned this would include ending the tapering or delaying it. That took stocks higher. Let’s take a look at today’s numbers.
S&P Market Direction Intraday for Feb 27 2014
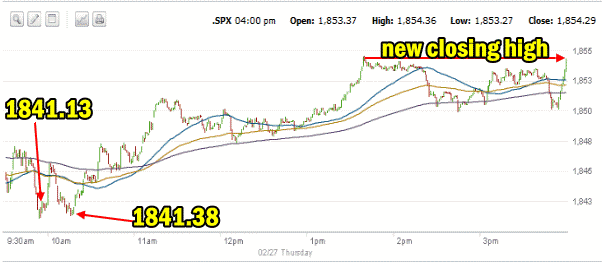
Today’s 1 minute chart of the S&P started the day off the same as prior days. The morning saw selling as the S&P sold back down once again to support at the 1840 level as the first sell-off took the SPX down to 1841.13 and then after a short second rally, the S&P was down again at 1841.38. The market them started another rally which moved right into Yellen’s testimony. Whether the Quantitative Easing programs worked or not still needs years to decide but one thing is known. Stocks love the sound of liquidity and with now with Bernanke’s Put replaced with Yellen’s Put, stocks moved higher and finally set up a new closing high..

Advance Declines For Feb 27 2014
Today’s advance decline ratio was once again slightly better for the bulls as advancing issues rose to 66% versus 31% declining issues. New highs dropped off somewhat though with 154 new highs but again just 74 new lows. One again the advance decline ratio is favoring the bulls..
Market Direction Closings For Feb 27 2014
The S&P closed at 1854.29 up just 9.13. The Dow closed at 16272.65 up 74.24 The NASDAQ closed at 4318.93 up 26.87.
The Russell 2000 ETF IWM sclosed at 117.99 up 64 cents.
Market Direction Technical Indicators At The Close of Feb 27 2014
Let’s review the market direction technical indicators at the close of Feb 27 2014 on the S&P 500 and view the market direction outlook for Feb 28 2014.

The 1750 level is holding the S&P up. Today the S&P closed above the 1840 level for the fourth day. The S&P also closed at a new all-time high.
For Momentum I am using the 10 period. Momentum has been the best indicator over the past two months, replacing MACD as the most accurate indicator. Momentum which over the past several days has been declining, today finally turned around and climbed higher.
For MACD Histogram I am using the Fast Points set at 13, Slow Points at 26 and Smoothing at 9. MACD (Moving Averages Convergence / Divergence) issued a buy signal on Feb 11. MACD moved lower again today despite the rally higher in the S&P. The move lower though was small enough that the MACD can still be considered as supporting the move higher.
The Ultimate Oscillator settings are Period 1 is 5, Period 2 is 10, Period 3 is 15, Factor 1 is 4, Factor 2 is 2 and Factor 3 is 1. These are not the default settings but are the settings I use with the S&P 500 chart set for 1 to 3 months.
The Ultimate Oscillator has turned back positive and is moving higher again today.
Rate Of Change is set for a 21 period. The rate of change jumped dramatically by the close signaling a change in trend. This could be signaling that the sideways action is ending and the market direction is set to move higher.
For the Slow Stochastic I use the K period of 14 and D period of 3. The Slow Stochastic issued a buy signal today one day after yesterday’s sell signal and it still extremely overbought.
For the Fast Stochastic I use the K period of 20 and D period of 5. These are not default settings but settings I set for the 1 to 3 month S&P 500 chart when it is set for daily. The Fast Stochastic is also extremely overbought and despite yesterday’s sell signal, the Fast Stochastic is now back to up.
Market Direction Outlook And Strategy for Feb 28 2014
The old saying in investing is “never fight the Fed”. I was surprised that Yellen commented how basically the Fed would do everything necessary including end the tapering if the Federal Reserve officials felt that the economy needed it. This effectively placed another put under the market replacing the Bernanke Put with the Yellen Put, so to speak. It’s never wise to fight the type of liquidity the Federal Reserve is happy to dump into the markets.
I wrote an article today about the effects of the Weekly Initial Unemployment Insurance Claims coming in at 348,000 for stocks. I still think even with liquidity, if the claims continue to climb stocks will have a tough time of it. That said even if tomorrow stocks are weaker than I expect, it will take a different catalyst after Yellen’s testimony to push stocks a lot lower.
All the market direction technical indicators are back to pointing to more upside for stocks. For now then the move is back to up. As long as the unemployment numbers co-operate, March’s market direction might surprise to the upside.
Market Direction Internal Links
Profiting From Understanding Market Direction (Articles Index)
Understanding Short-Term Signals
Market Direction Portfolio Trades (Members)
Market Direction External Links
Market Direction IWM ETF Russell 2000 Fund Info
Market Direction SPY ETF 500 Fund Info
