The Market Direction outlook for Wednesday was a repeat of Tuesday’s outlook, namely sideways with a slight bias up. Both day’s the markets have started off with dips in the morning and then highs by the noon hour. The rest of the day the market direction up has been having trouble and the afternoon has seen a lot of weakness. Today was no different other than a close that was slightly positive. Let’s take a look at today’s action.
S&P Market Direction Intraday for Feb 26 2014
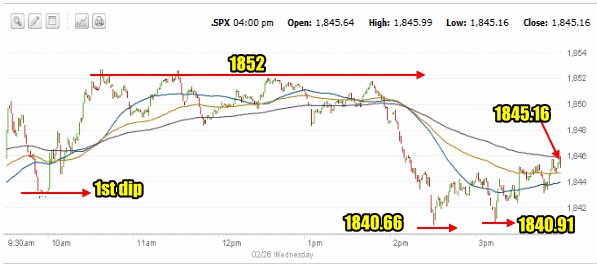
Today’s 1 minute chart of the S&P has a lot of similarity to yesterday’s again. We saw a dip in the morning and then a push to try to set a new high. Intraday the S&P got above 1852 but then in the afternoon shortly before 2:00 PM the market started to sell-off again. It pushed all the way back to 1840.66 and a second pullback fell to 1840.91. This could easily be another test of support and at least this time the market stayed above 1840. The close at 1845.16 saw the S&P up just 0.04.

Advance Declines For Feb 26 2014
Today’s advance decline ratio was slightly better for advancing issues with 59% advancing and 38% declining. New highs were better though with 181 new highs versus 80 new lows.
Market Direction Closings For Feb 26 2014
The S&P closed at 1845.16 up just 0.04. The Dow closed at 16198.41 up 18.75. The NASDAQ closed at 4292.06 up 4.48.
The Russell 2000 ETF IWM set another new all-time high today at 118.11 before closing at 117.35 up 72 cents..
Market Direction Technical Indicators At The Close of Feb 26 2014
Let’s review the market direction technical indicators at the close of Feb 26 2014 on the S&P 500 and view the market direction outlook for Feb 27 2014.

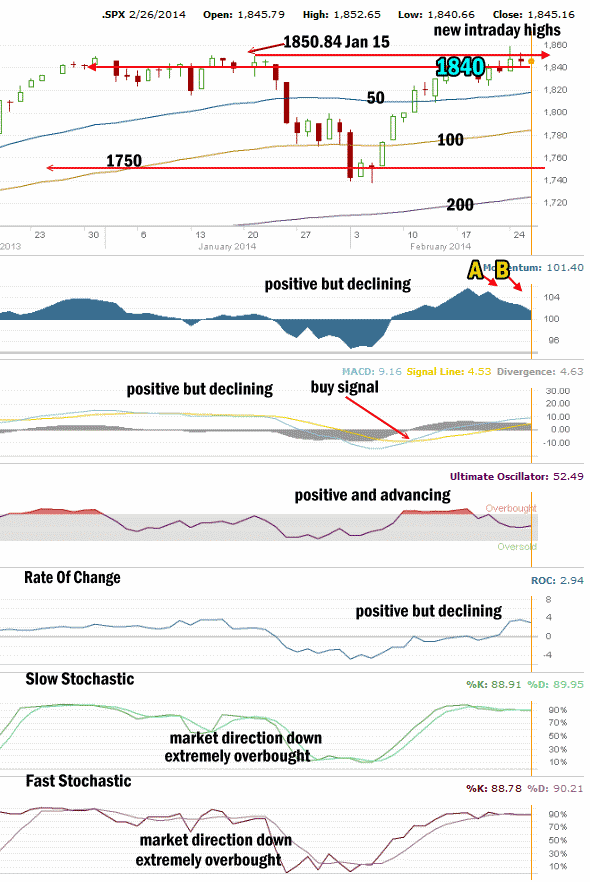
The 1750 level is holding the S&P up. Today the S&P closed above the 1840 level for the third day. During the day it pushed back above the previous all-time high again but also sold back down to retest the 1840 level. The market direction higher is still stuck fighting resistance at the 1840 level.
For Momentum I am using the 10 period. Momentum has been the best indicator over the past two months, replacing MACD as the most accurate indicator. Today momentum fell lower again. While it is still positive the movement lower shows that the sideways action of stocks is having an impact on momentum.
For MACD Histogram I am using the Fast Points set at 13, Slow Points at 26 and Smoothing at 9. MACD (Moving Averages Convergence / Divergence) issued a buy signal on Feb 11. MACD moved lower again today although once again the reading is still quite positive.
The Ultimate Oscillator settings are Period 1 is 5, Period 2 is 10, Period 3 is 15, Factor 1 is 4, Factor 2 is 2 and Factor 3 is 1. These are not the default settings but are the settings I use with the S&P 500 chart set for 1 to 3 months.
The Ultimate Oscillator has turned back positive and is moving higher.
Rate Of Change is set for a 21 period. The rate of change as expected as turned lower. It is still positive but it is signaling that the next change could be negative for stocks..
For the Slow Stochastic I use the K period of 14 and D period of 3. The Slow Stochastic issued a sell signal today and it still extremely overbought.
For the Fast Stochastic I use the K period of 20 and D period of 5. These are not default settings but settings I set for the 1 to 3 month S&P 500 chart when it is set for daily. The Fast Stochastic is also extremely overbought and for the second day it is signaling the market direction is down..
Market Direction Outlook And Strategy for Feb 27 2014
The market direction today was disappointing although the Dow managed to close higher and the IWM ETF moved to another new all-time high. But the technical indicators are strongly mixed. Four are still positive and two are negative. The problem is even the positive indicators are falling. Still though the majority are still positive. With the two stochastic indicators both issuing sell signals though, tomorrow could be a tougher day for stocks.
The outlook is more mixed now than just sideways. With 4 indicators still positive I should probably indicate that stocks will be marginally higher on Thursday but with the stochastic’s both pointing to lower for stocks, I have to place more weight this time with the stochastics. Tomorrow then I am expecting stocks to move sideways but return to a bias lower.
Market Direction Internal Links
Profiting From Understanding Market Direction (Articles Index)
Understanding Short-Term Signals
Market Direction Portfolio Trades (Members)
Market Direction External Links
Market Direction IWM ETF Russell 2000 Fund Info
Market Direction SPY ETF 500 Fund Info
