Market Direction today ended up pretty much as expected with a bounce back after a big down day on Monday. The news today though was really all about the Fed chairman and the continued support for Quantitative Easing to continue until unemployment falls lower. Market Direction remained buoyed by the news and attempted to close on the highs for the day.
But the S&P is still below the 1500 level and the Dow Index below 14000. Both indexes staged good attempts to recover some of the lost ground however.
Market Direction Action For Today
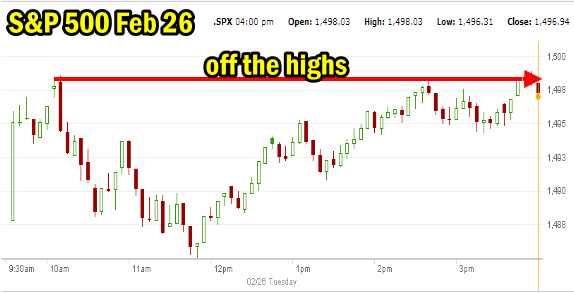
Below is the S&P 500 chart for Tuesday Feb 26 2013. The market staged a strong recovery from the lows before noon. Still they closed off the highs of the day which were made at the open within half an hour.

S&P 500 market direction chart for Feb 26 2013
Market Direction Closings
The S&P 500 closed at 15496.94, up 9.09 points and the Dow closed at 13,900.13, up 115.98 points. The NASDAQ closed at 3129.65 up 13.40.
Market Direction Technical Indicators At The Close of Feb 27 2013
Let’s take a moment now and review the market direction technical indicators at today’s close on the S&P 500 and view the next trading day’s outlook.

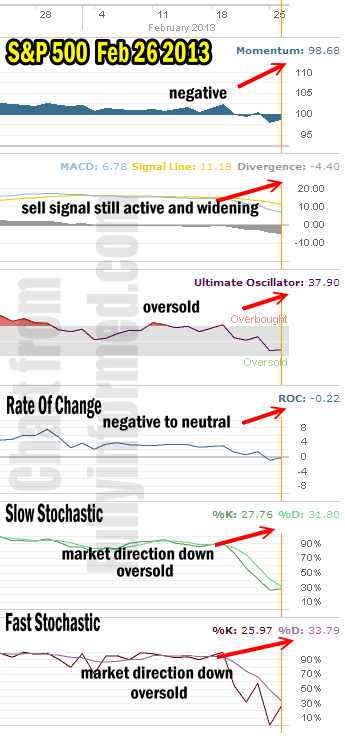
Market Direction Technical Indicators for Feb 26 2013
For Momentum I am using the 10 period. Momentum is still negative although it did climb today.
For MACD Histogram I am using the Fast Points set at 13, Slow Points at 26 and Smoothing at 9. MACD (Moving Averages Convergence / Divergence) is not only still signaling market down but it was unimpressed with today’s rally attempt and the sell signal if widening.
The Ultimate Oscillator settings are Period 1 is 5, Period 2 is 10, Period 3 is 15, Factor 1 is 4, Factor 2 is 2 and Factor 3 is 1. These are not the default settings but are the settings I use with the S&P 500 chart set for 1 to 3 months.
The Ultimate Oscillator is still negative and oversold but it is turning sideways which indicates a possible bottom or at least a slow-down in selling.
Rate Of Change is set for a 21 period. Rate Of Change is negative but almost more neutral than negative.
For the Slow Stochastic I use the K period of 14 and D period of 3. The Slow Stochastic is oversold and despite today’s rally it is signaling that the markets will be lower later this week.
For the Fast Stochastic I use the K period of 20 and D period of 5. These are not default settings but settings I set for the 1 to 3 month S&P 500 chart when it is set for daily. The Fast Stochastic is also oversold and indicating that the market direction is still down.
Market Direction Outlook And Strategy for Feb 27 2013 (NEXT DAY)
The market direction outlook for the next trading day is to see perhaps a weak opening and then another attempt to rally higher. This rally may have trouble as the technicals are predicting that the market direction outlook is lower for the next few trading sessions. As we are almost finished with February I will not be surprised to see some selling and then possibly an attempt at a bigger rally on March 1 to start the next month.
Meanwhile my strategy is still the same, cautious but still invested as the market direction works toward sorting itself out but at least we know where the Fed Chairman stands for the moment and that is bound to help market direction recover shortly.
Internal Market Direction Links
Profiting From Understanding Market Direction (Articles Index)
Understanding Short-Term Signals
Market Direction Candlestick Daily View (Members only)
Market Direction Portfolio Ongoing Trades (Members only)
Market Direction External Links
