The Market Direction outlook for Tuesday was for stocks to turn sideways but retain an upward bias. This occurred for much of the day as the S&P continued to try to set a new high. Instead though the indexes closed lower. But the losses were marginal with the S&P closing back above 1840 for the second day in a row. This is what the market direction up needs. Building support is a process that takes time. 1840 has been resistance for a very long time and that resistance will not be broken in just a few closings above 1840. It will take many closings before 1840 will develop support levels. At this time then, 1750 is still the strongest support level for stocks.
China dominated the news yet again with concern about a slowing economy, rising rates and lower commodity prices pressuring stocks. Added to this was the consumer confidence numbers which showed a dip to 78.1 in February from 79.4 in January. Still though these are decent numbers even at 78.1 but still any excuse can be looked at by analysts as reasons for the market to move sideways.
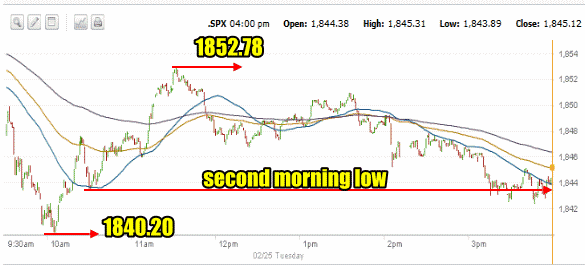
S&P Market Direction Intraday for Feb 25 2014
Today’s 1 minute chart of the S&P has a lot of similarity to yesterday’s. This is typical of a market that is having trouble breaking through resistance and it needs to be watched. Like yesterday stocks pushed lower in the morning. Today by 10:00 AM the market had tested 1840 and began a push higher. A second pullback around 10:30 saw the S&P down around the 1844 level. From there a rally took the S&P back to an Intraday high of 1852.78 before once again selling moved in. The market direction changed to down and sellers pushed stocks lower until by the close the market ended up near the early morning second pullback which copied yesterday’s open and close. Pressure is enormous at this level in the S&P. Resistance from sellers is almost relentless as each time the market moves higher and investors look for new buyers there are not many and this brings out the sellers who take profits. Just as the market can only go sideways for so long, this action on the part of investors will only last so long as well. Eventually if there are not enough buyers the market must pull back to find new ones.

The belief being talked about among analysts and media pundits just a day ago was that the fund managers had been supposedly holding “the market back” while they continued to pick up stocks. That certainly might be true as stocks are always manipulated to one degree or another, but today’s action would seem to suggest a lack of buyers rather than any kind of control over stocks by fund managers. If the S&P fails to hold 1840 at this point I believe it will pull back until it can find buyers. We will have to wait as see what the rest of this week brings for stocks.
Advance Declines For Feb 25 2014
Yesterday I commented on how only 59% of stocks were advancing despite the big rise in stocks. Today that number was down to 45% with 52% stocks declining. New highs declined to 144 and new lows were almost unchanged from yesterday at 76. As explained in prior market direction outlooks, the advance decline ratio has a bias to the upside but momentum is continuing to fall away from stocks as they struggle to break through resistance.
Market Direction Closings For Feb 25 2014
The S&P closed at 1845.12 down 2.49. The Dow closed at 16179.66 down 27.48. The NASDAQ closed at 4287.59 down 5.38.
The Russell 2000 ETF IWM again rose to 117.24 just slightly below yesterday’s 117.31 and the all-time high of 117.37. It closed at 116.63 up just 12 cents on the day.
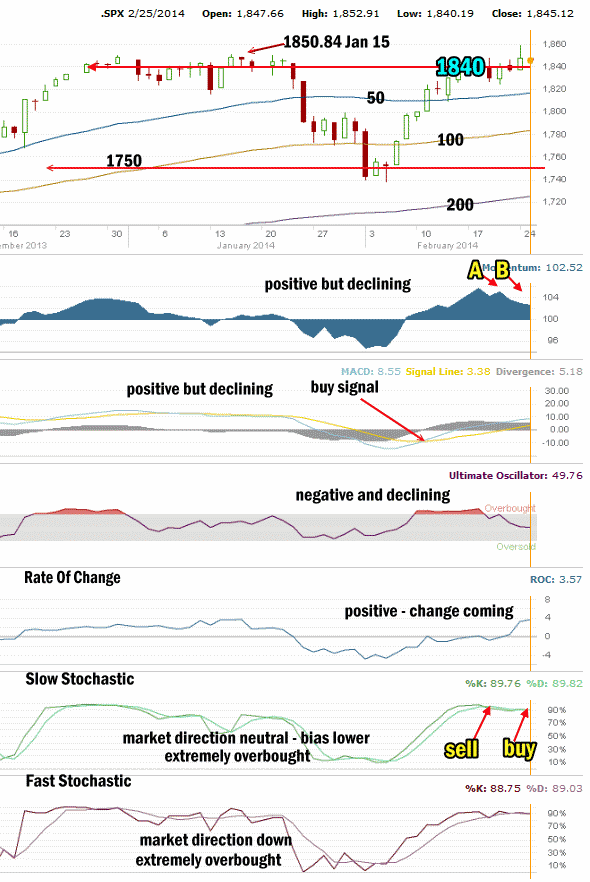
Market Direction Technical Indicators At The Close of Feb 25 2014
Let’s review the market direction technical indicators at the close of Feb 25 2014 on the S&P 500 and view the market direction outlook for Feb 26 2014.

The 1750 level is holding the S&P up. Today the S&P closed above the 1840 level for the second day. During the day it pushed back above the previous all-time high but once again sold back down. The market direction higher is still stuck fighting resistance at the 1840 level.
For Momentum I am using the 10 period. Momentum has been the best indicator over the past two months, replacing MACD as the most accurate indicator. Today momentum moved just marginally lower than yesterday but it is still positive.
For MACD Histogram I am using the Fast Points set at 13, Slow Points at 26 and Smoothing at 9. MACD (Moving Averages Convergence / Divergence) issued a buy signal on Feb 11. MACD moved lower again today although with a reading of 5.18 it is still strongly positive.
The Ultimate Oscillator settings are Period 1 is 5, Period 2 is 10, Period 3 is 15, Factor 1 is 4, Factor 2 is 2 and Factor 3 is 1. These are not the default settings but are the settings I use with the S&P 500 chart set for 1 to 3 months.
The Ultimate Oscillator has turned negative but only slightly. Still this marks a continuing decline..
Rate Of Change is set for a 21 period. The rate of change took a big jump higher yesterday and today turned sideways. This normally signals a change in the market direction. This means the market direction is either going to move swiftly higher from here or pull back. The weakness being seen in many of the technical indicators could be signs that the direction will shift to lower.
For the Slow Stochastic I use the K period of 14 and D period of 3. The Slow Stochastic is close to neutral but has a slight bias lower. The sell signal was negated yesterday by a buy signal but the buy signal saw no confirmation today. Even a slight move lower tomorrow will see a sell signal from the Slow Stochastic.
For the Fast Stochastic I use the K period of 20 and D period of 5. These are not default settings but settings I set for the 1 to 3 month S&P 500 chart when it is set for daily. The Fast Stochastic is also extremely overbought and yesterday the signal was for an up market on Tuesday. This happened only in the morning but the lower close today and continuing decline of momentum has pushed the Fast Stochastic into a very weak sell signal. With both readings so close it is almost neutral for tomorrow..
Market Direction Outlook And Strategy for Feb 26 2014
DAs I indicated yesterday there is definite weakness within the markets. The IWM is perhaps the strongest followed by the S&P and NASDAQ markets. The Dow is the weakest of these indexes and continues to trade just above its 50 day simple moving average (SMA).
There is not a lot more to report this evening for tomorrow’s market. There is still strength here but the sideways pattern continues to confound investors and analysts. The rally back from the recent sell-off was swift but has seemed to run out of steam. The technical indicators are all turning weaker. MACD still has a decent reading but a few more down days and it will begin to fall quickly. Building support is never easy but if the 1840 level fails then stocks will pull back as they seek buyers. The Rate Of Change is still advising that a bigger change in coming. Let’s hope it is not to the downside.
Today’s readings are pointing to an almost neutral outlook. My personal feeling is the market wants to hold 1840 but without more conviction among buyers it is questionable whether it can move higher. Remember too that the last week of February is almost always poor and that could be a factor as well. Yesterday’s big jump and then the pull back was hard on investor confidence. Today’s move higher into the lunch hour and then sell-off just adds to that lack of conviction. Still enough investors are pushing for higher valuations and they may in the end win out and get the S&P higher. Right now though for Wednesday the market looks still sideways with a slight bias to the upside although the technical indicators are not really pointing up but probably closer to lower.
This is the type of market direction that builds choppy trading and keeps volatility up.
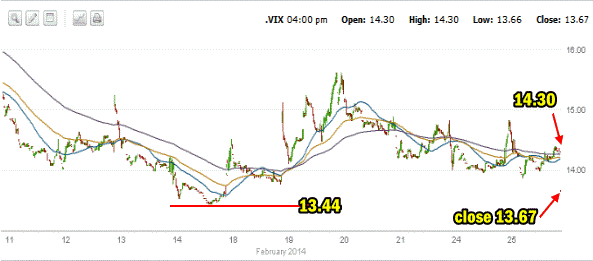
VIX Index Chart – 10 Days
I was surprised at the close today when the VIX Index was at 14.30 and then suddenly traded down at 13.67 with just a minute into the close. Leaving out the close, volatility is continuing to slowly creep higher.

This is what makes trading exciting. Put premiums are also creeping higher making it possible to continue to sell puts for decent premiums but not having to commit as much capital due to the higher prices. This means I can continue to sell puts on my favorite stocks while at the same time hold more cash back. I am busy doing both this week. Tomorrow then look for the trend to remain fairly sideways with a slight bias to the upside.
Market Direction Internal Links
Profiting From Understanding Market Direction (Articles Index)
Understanding Short-Term Signals
Market Direction Portfolio Trades (Members)
Market Direction External Links
Market Direction IWM ETF Russell 2000 Fund Info
Market Direction SPY ETF 500 Fund Info
