Market Direction today is following the course charted last night by the market direction technical indicators. Lots to talk about so let’s jump right in.
Market Direction and Unemployment Numbers
The Weekly Initial Unemployment Insurance Claims jumped 20,000 last week rising to 362,000. Anything above 370,000 and the stock market direction has tended to sell lower. While many economists felt that the numbers would be revised lower in coming weeks, these numbers do show that hiring is still on the slow side. Even the four-week average which many point to as being far less volatile were up 8,000 to 360,750 which is the highest in 6 weeks. Basically since the start of November employers have added about 200,000 jobs a month which is up from 150,000 from the August to October 2012 period. Any further signs of numbers rising though could hurt the chance of a market direction rally higher into March or April so this bears watching.
Market Direction and Retail Numbers
Meanwhile more and more retailers are lowering forecasts and adjusting their marketing plans as higher taxes and fuel costs may impact consumer spending more than originally anticipated. Earlier this week Walmart Stores had rumors of a worst month than expected due to payroll tax increases. All of this may put a road block in front of a push higher in the overall stock market direction. Walmart bounced considerably higher but I am staying with my puts and watching closely for any serious pullback to close and move my naked puts lower especially if the market direction turns lower.
Market Direction and Stock Bargains
There were a number of great bargains on the market’s today thanks to the market direction push lower. I sold puts against Nucor Stock which fell dramatically, Dupont Stock, and Apple Stock was excellent throughout the day and I did a number of puts on Apple Stock.
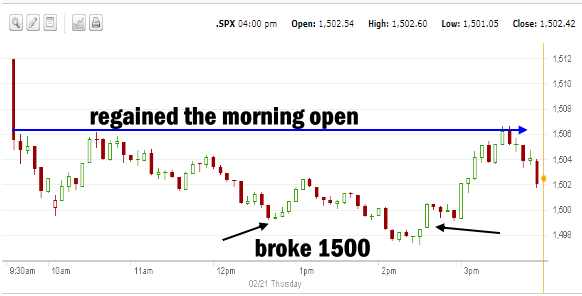
S&P Market Direction Feb 21 – 5 minute chart
The S&P 500 dropped at the open and broke 1500 twice during the day. Toward the close the S&P 500 managed to regain the morning open after the initial collapse which is a good sign, but it closed lower. Nonetheless the market direction still looks decent as the S&P fought to retain the 1500 level.

Market Direction SPX 5 minute chart for Feb 21 2013
Market Direction Closings
The S&P 500 closed at 1502.42 down 9.53 points and the Dow closed at 13,880.62 down 46.92 points. The NASDAQ closed at 3131.49 down 32.92.
Market Direction Technical Indicators At The Close of Feb 21 2013
Let’s take a moment now and review the market direction technical indicators at today’s close on the S&P 500 and view the next trading day’s outlook.

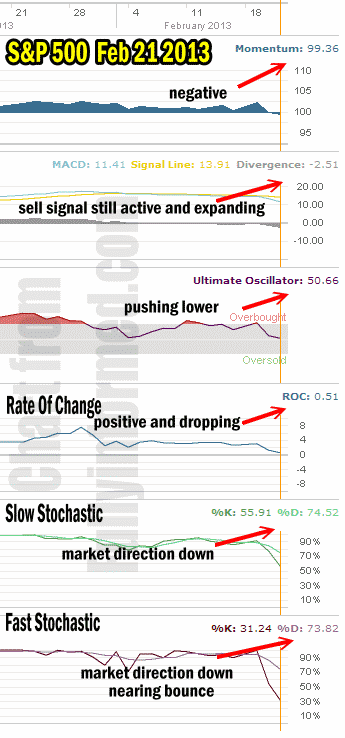
Market Direction technical analysis Feb 21 2013
For Momentum I am using the 10 period. Momentum is snow negative but only slightly which could easily be turned back up with a market direction bounce tomorrow.
For MACD Histogram I am using the Fast Points set at 13, Slow Points at 26 and Smoothing at 9. MACD (Moving Averages Convergence / Divergence) is still flashing the sell signal and the divergence is widening indicating more selling ahead and market direction lower.
The Ultimate Oscillator settings are Period 1 is 5, Period 2 is 10, Period 3 is 15, Factor 1 is 4, Factor 2 is 2 and Factor 3 is 1. These are not the default settings but are the settings I use with the S&P 500 chart set for 1 to 3 months.
The Ultimate Oscillator is still positive but barely. Yet despite the selling and the breaking of the S&P 500 the Ultimate Oscillator has managed to hang on while the market direction fell back below 1500.
Rate Of Change is set for a 21 period. Rate Of Change is still positive which is also decent considering the collapse in the market direction today. This could signal that selling may be a bit overdone and may turn sideways with a bias back to up.
For the Slow Stochastic I use the K period of 14 and D period of 3. The Slow Stochastic has no such outlook for the market direction up to possibly be recovered. Indeed it is pointing to the market direction being lower into the start of next week.
For the Fast Stochastic I use the K period of 20 and D period of 5. These are not default settings but settings I set for the 1 to 3 month S&P 500 chart when it is set for daily. The Fast Stochastic is almost oversold and is nearing bounce readings for the market direction to push back up tomorrow. Meanwhile though the readings are bearish and indicate that market direction may bounce but the trend remains for market direction to turn lower.
Market Direction Outlook And Strategy for Feb 22 2013
The market direction outlook for tomorrow is for a possible technical bounce after two days of selling and then for the market direction to continue selling lower. The bounce back tomorrow would be technical in nature and I will not be chasing any stocks. If there is a bounce I will only be Put Selling against my favorite stocks that sell lower.
As the market direction Technical Analysis indicates that the market direction overall is still lower I see no reason to get all more naked puts working yet. Instead any puts that can be bought and closed for profits in a bounce are the best possible trade should we see a bounce in Market Direction. After that I will be back Put Selling as stocks move lower.
I noted that Doug Harris with his market direction portfolio adjusted his position twice today. FullyInformed Members might want to check out his comments for today.
Remember that a correction is long overdue for the market direction but that does not mean it will last weeks. Don’t fret the articles out talking about how this is the worst downturn since the rally started. That’s hardly obvious. Instead remember that this is a bull market that has had a terrific run-up and like all run-ups, it over extended itself.
The market direction correction may only last a few days before the market direction turns back up. However there must be a further catalyst to push stocks above the latest 5 year highs and until I see such a catalyst appear I believe the strategy of staying cautious, trading in small positions, closing when profits appear, looking for new opportunities and keeping cash at the ready remains the best way to stay invested at this time
Internal Market Direction Links
Profiting From Understanding Market Direction (Articles Index)
Understanding Short-Term Signals
Market Direction Candlestick Daily View (Members only)
Market Direction Portfolio Ongoing Trades (Members only)
Market Direction External Links
Market Direction IWM ETF Russell 2000 Fund Info
Market Direction SPY ETF 500 Fund Info
.
