The cautionary stance for Market Direction continues to work as today the S&P 500 moved higher setting more new highs and then pulled back as the Dow fell in mid-afternoon trading. The sideways actions with a bias to the upside continues to dominate market direction.
Market Direction Action For Today
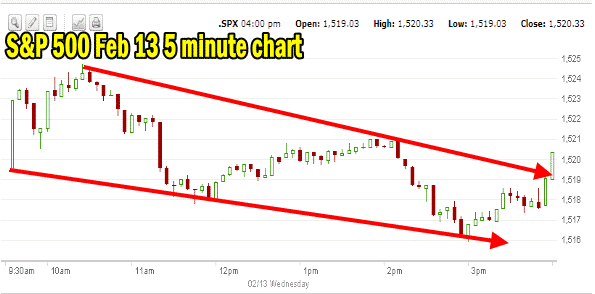
Market Direction started off with early gains and then turned down by mid-morning. The rest of the day the market continued to fall until the usual push back for the last hour of trading. The overall action however was sideways. Market breadth today remained bullish. The advance decline line made another new high.

5 minute S&P 500 chart for Feb 13 2013
Market Direction Closings
The S&P 500 closed at 1520.33, up 0.90 points and the Dow closed at 13,982.91, down 35.79 points. The NASDAQ closed at 31696.88 up 10.38.
Market Direction Technical Indicators At The Close of Feb 13 2013
As the sideways market continues the market direction technical indicators take on more importance as we watch to make sure that there is enough strength in the market direction to keep stocks from faltering. Let’s take a moment now and review the market direction technical indicators at today’s close on the S&P 500 and view the next trading day’s outlook.

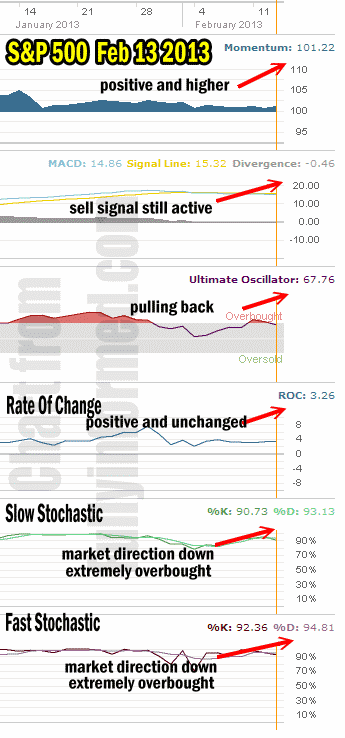
market direction technical indicators for Feb 13 2013
For Momentum I am using the 10 period. Momentum is still positive and up slightly from yesterday but again it remains more sideways than up or down.
For MACD Histogram I am using the Fast Points set at 13, Slow Points at 26 and Smoothing at 9. MACD (Moving Averages Convergence / Divergence) is still signaling market direction lower and today the MACD signal is lower than yesterday.
The Ultimate Oscillator settings are Period 1 is 5, Period 2 is 10, Period 3 is 15, Factor 1 is 4, Factor 2 is 2 and Factor 3 is 1. These are not the default settings but are the settings I use with the S&P 500 chart set for 1 to 3 months.
The Ultimate Oscillator is still positive but is falling away from the overbought readings of earlier in the week.
Rate Of Change is set for a 21 period. Rate Of Change is still positive and basically unchanged for the week which signals that the market direction remains sideways.
For the Slow Stochastic I use the K period of 14 and D period of 3. The Slow Stochastic is overbought to the extreme and is now signaling that the market direction is shifting to down.
For the Fast Stochastic I use the K period of 20 and D period of 5. These are not default settings but settings I set for the 1 to 3 month S&P 500 chart when it is set for daily. The Fast Stochastic is also extremely overbought and it confirms the Slow Stochastic as it also is signaling that the market direction is lower.
Market Direction Outlook And Strategy for Feb 14 2013
The market direction outlook for Thursday Feb 14 is for the market direction to remain weak. Tomorrow we get the Weekly Initial Unemployment Insurance Claims and if they are decent the market direction could bounce. Overall though the general consensus is for the sideways movement to continue but now the bias is changing to down from up. We could therefore see some movement lower again tomorrow in the market direction. The sideways movement makes investing difficult but Put Selling can assist as I am selling strikes below where stocks are presently trading and most are at least 5% lower than where stocks are right now. This affords me some protection against being assigned too many stocks if the market direction should change to lower. Put Selling allows me to continue to grow my profits while waiting for a clear direction. One thing to remember at this stage of the rally is that market direction has been up since the start of the year and at some point a correction will come. In order for stocks to then move higher earnings must also move higher than they are this quarter. It’s important to keep that in mind when assessing which stocks to do Put Selling against. Caution is still the best course of action when investing in the present markets.
Internal Market Direction Links
Profiting From Understanding Market Direction (Articles Index)
Understanding Short-Term Signals
Market Direction Candlestick Daily View (Members only)
Market Direction Portfolio Ongoing Trades (Members only)
