Market Direction today didn’t follow along as the Fast Stochastic showed yesterday. Market direction today shows the growing concerns investors have over Europe and the continuing US unemployment picture. As soon as Europe re-entered the picture the market direction up stalled so Europe that had disappeared from the economic picture has returned. The problems in Europe are not going to disappear probably for years so I am sure economic problems from Europe will keep reappearing from time to time. But there are some other warning signs that investors should be aware of. More on that in a moment.
Market Direction Action For Today
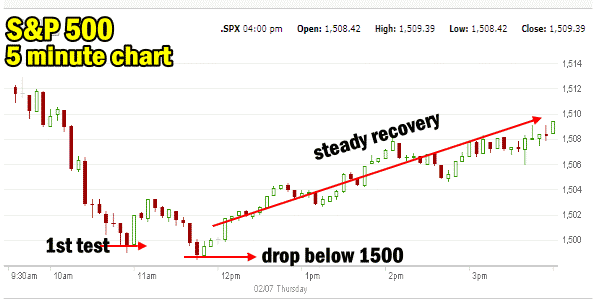
There are some interesting developments in today’s chart of the S&P 500. The 5 minute chart of the S&P for today is below. There was NO gap down this morning. The selling fell all the way to 1500 before 11:00. Then a slight bounce followed by a drop below 1500. It could possibly be considered a test of the 1500 level on the S&P. Following the second drop the market spent the rest of the day with a steady recovery. The question then is whether this is a confirmed test of 1500 on the S&P which means the market direction will now continue higher.

Market Direction Feb 07 2013 5 minute chart
To understand more we will look at the market direction technical closings for today.
Market Direction Closings
The S&P 500 closed at 1509.39, down 2.73 points and the Dow closed at 13,944.05, down 42.47 points. The NASDAQ closed at 3165.13 down 3.34.
Market Direction Technical Indicators At The Close of Feb 07 2013
Let’s take a moment now and review the market direction technical indicators at today’s close on the S&P 500 and view the next trading day’s outlook.

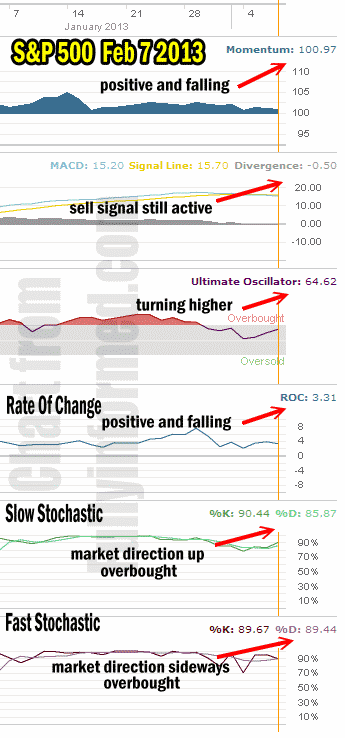
Market Direction Feb 07 2013
For Momentum I am using the 10 period. Momentum is still positive but it is continuing to fall.
For MACD Histogram I am using the Fast Points set at 13, Slow Points at 26 and Smoothing at 9. MACD (Moving Averages Convergence / Divergence) is still negative and confirming the sell signal of Jan 30.
The Ultimate Oscillator settings are Period 1 is 5, Period 2 is 10, Period 3 is 15, Factor 1 is 4, Factor 2 is 2 and Factor 3 is 1. These are not the default settings but are the settings I use with the S&P 500 chart set for 1 to 3 months.
The Ultimate Oscillator is still positive and is back rising which is one of the few bullish signs of the market direction.
Rate Of Change is set for a 21 period. Rate Of Change is still positive but back falling.
For the Slow Stochastic I use the K period of 14 and D period of 3. The Slow Stochastic is overbought and signaling that the market direction is up.
For the Fast Stochastic I use the K period of 20 and D period of 5. These are not default settings but settings I set for the 1 to 3 month S&P 500 chart when it is set for daily. The Fast Stochastic is also overbought and signaling that the market direction is shifting to sideways.
Market Direction Warnings Signs
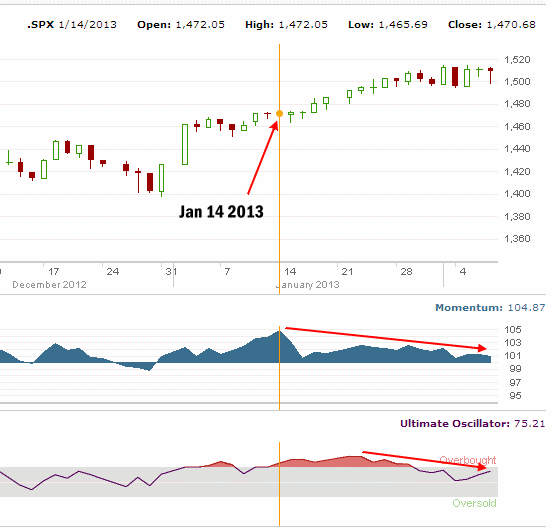
There are some warnings signs that investors should be aware of. Momentum since January 14 2013 has peaked and continued to decline. These are signs of an impending market pullback. Momentum cannot keep declining and yet the market direction continue higher indefinitely. The Ultimate Oscillator peaked about a week later and it too is declining, another signal of weakness in the market direction.

Market Direction Warning Signals
Market Direction Outlook And Strategy for Feb 08 2013
The market direction outlook for the next trading day is to see perhaps a weak start and then an attempt to push higher. At this stage of the rally whether the market is consolidating for a move higher or preparing to pull back, I believe without momentum any market direction higher has to be suspect. My trading strategy is exactly the same as before, namely cautious. I continue with small positions in my favorite stocks but overall momentum must improve for me to increase position sizes.
There are not indicators that signal a large drop is coming. Instead indicators are signaling weakness in the markets which is leading to the market direction having trouble continuing higher. A lot of capital has flowed into stocks, but perhaps this is another signal that the market will pull back before moving higher. It is rare when the majority of investors are right and since the rally got underway investors are busy buying and pushing many stocks into over valuations. Market direction can certainly continue higher with overvalued prices and low momentum, but the result is normally that the market direction will eventually turn down and the higher it is when that happens, the more deep the decline might be. Staying cautious is as before – warranted.
Internal Market Direction Links
Profiting From Understanding Market Direction (Articles Index)
Understanding Short-Term Signals
Market Direction Candlestick Daily View (Members only)
Market Direction Portfolio Ongoing Trades (Members only)
