The market direction outlook for Wednesday was for stocks to try to bounce but remain weak and move lower. The opening saw a small push lower and then a bounce back in all the indexes including IWM ETF. When the bounce failed, investors turned once more to selling and eventually later in the afternoon they pushed stocks lower. Let’s take a look at the action for today to see what it might tell us about Thursday.
Market Direction S&P 500 Intraday For Dec 4 2013
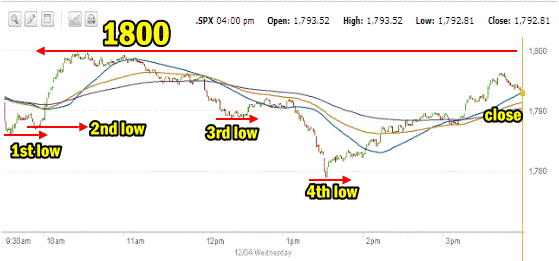
The one minute chart below shows the action for Dec 4. There were 4 lows during the day. The low around 1:30 was somewhat unexpected. I had not anticipated that strong a selling reaction for the afternoon. The selling though brought in a lot of buyers. They pushed the S&P back up but failed to retake the 1800 level. The close though was still somewhat inspiring with the low point of the day being so quickly recovered.

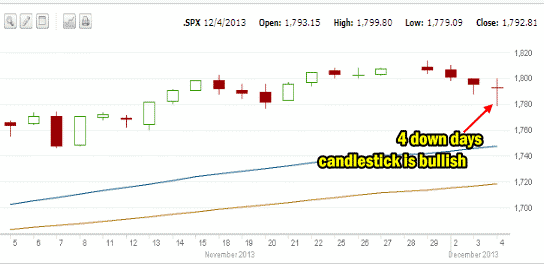
Four Down Days And A Bullish Close
After four days of selling, today push lower to around the 1780 level was enough to drag investors back to stocks. With the movement lower, many investors who have missed much of the rally took advantage of the lower prices and jumped into stocks this afternoon. The candlestick after four down days was actually quite bullish. The long tail shows that the market closed far off the lows of the day. We have not had a lot of days with four or five steady down days this year so today obviously brought in more investors who felt that selling was a bit overdone and wanted to pick up stocks now rather than wait to see if the market direction continues to move lower.

IWM ETF Direction
The IWM ETF followed the S&P and DOW as it closed well off its lows for the day as well.
Advance Declines For Dec 4 2013
Declining issues outpaced advancing issues by the same margin as Tuesday with 60% declining versus 37% advancing. The new highs were at 67 but the new lows were at 131.
Market Direction Closing For Dec 4 2013
The S&P 500 closed at 1,792.81 down 2.34. The Dow closed at 15,889.77 down 24.85. The NASDAQ closed at 4038.00 up 0.80
The IWM ETF closed at $111.53 down .30 cents for the day.
Market Direction Technical Indicators At The Close of Dec 4 2013
Let’s review the market direction technical indicators at the close of Dec 4 2013 on the S&P 500 and view the market direction outlook for Dec 5 2013.

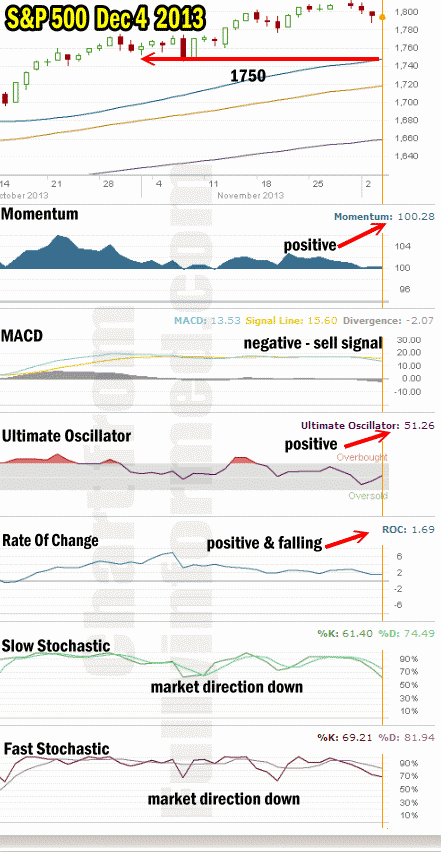
The most important support line in the S&P 500 at this time in the ongoing rally remains 1750. That support line is holding the market direction up at present and that has not changed. Today marked the second day the S&P has been back below 1800 in 6 days, but today saw a nice bounce back from a mid-afternoon low.
For Momentum I am using the 10 period. Momentum is still positive and despite today’s selling, it closed still positive although once again just barely. Still this remains a good sign in the face of selling and is signaling that the market wants to move higher.
For MACD Histogram I am using the Fast Points set at 13, Slow Points at 26 and Smoothing at 9. MACD (Moving Averages Convergence / Divergence) issued a weak sell signal on Friday Nov 29 when MACD was slightly negative. Today the sell signal continued to strengthen to the downside.
The Ultimate Oscillator settings are Period 1 is 5, Period 2 is 10, Period 3 is 15, Factor 1 is 4, Factor 2 is 2 and Factor 3 is 1. These are not the default settings but are the settings I use with the S&P 500 chart set for 1 to 3 months.
The Ultimate Oscillator bounced back higher and is back positive. The late afternoon rally impacted the Ultimate Oscillator greatly.
Rate Of Change is set for a 21 period. The Rate Of Change is positive but was moving lower again today.
For the Slow Stochastic I use the K period of 14 and D period of 3. The Slow Stochastic is signaling that the market direction is down.
For the Fast Stochastic I use the K period of 20 and D period of 5. These are not default settings but settings I set for the 1 to 3 month S&P 500 chart when it is set for daily. The Fast Stochastic is signaling that the market direction is down.
Market Direction Outlook And Strategy for Dec 5 2013
The market direction technical indicators are pointing to the market direction being lower gain tomorrow but there are a number of technical signs that the market direction may bounce back starting tomorrow. Momentum has remained positive and the Ultimate Oscillator jumped from negative to positive on the afternoon rally back from the day’s low. While MACD and the two stochastic indicators are still negative and point to a lower day tomorrow, the rate of change has not turned negative and remains positive although still moving slightly lower each day.
The move back from the mid-afternoon lows on all the indexes was impressive. Since the intraday all-time high on November 29 of 1813.55, the S&P has slipped just 34.46 points to the intraday low today of 1779.09. This marked a retreat of just 1.9% but for a lot of investors, the selling in the mnid-afternoon today was strong enough that a lot of investors felt it was overdone and that the market direction lower had perhaps peaked. They bought back in and pushed up a large number of stocks and moved the indexes back within reach of their respective highs.
While the consensus among the technical indicators is that the market direction will move lower tomorrow, I think the market is preparing for a bit of a bounce tomorrow, a day before the unemployment numbers are to be released. Once again, I would suggest being careful with covered calls on stock that you would prefer not to see exercised away in the event the market stages a rally that pushes back to new highs. There is a lot of strength in this market and the move back up from the mid-afternoon lows is telling investors that stocks want to bounce back up.
Market Direction Internal Links
Profiting From Understanding Market Direction (Articles Index)
Understanding Short-Term Signals
Market Direction Portfolio Trades (Members)
Market Direction External Links
Market Direction IWM ETF Russell 2000 Fund Info
Market Direction SPY ETF 500 Fund Info
