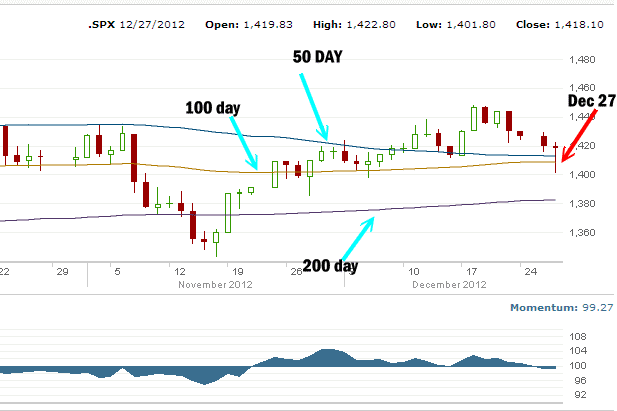
Today’s market direction swing was exciting to say the least. By mid-day markets were plunging after investors assessed that the fiscal cliff was probably a certainty. Rumors then started that a last minute ditch effort was underway and the markets started to rally which was then followed by denials and another move lower. Then the rumors appeared to have some truth and the market rallied all the way back to close down just 1.74 points to 1418.09.
Despite fiscal cliff worries dropping the markets like stone today, a lot of technical damage was done today.
Market Direction Chart For S&P 500
The market direction plunge broke the 50 day and 100 day moving averages. While the market rallied back on the rumors of a possible deal being worked on the fiscal cliff mess, the damage technically will see more selling. Just like the flash crash of May 2010, when a market direction breaks through key barriers it is rare when they are not followed with additional selling. Momentum today turned negative.
A resolution would definitely be a spring-board for a rally but even in that event I believe there is a good chance the markets would pull back after the initial euphoria.

S&P 500 market direction Dec 27 2012
Market Direction Technical Analysis of Dec 27 2012
Technically the breakout of Dec 11 which was confirmed on December 18 was broken. This does not mean that market will not rally higher on news of any fiscal cliff resolution. It does however mean that any higher prices will be tested by a pullback. Let’s look at today’s market direction indicators to review the action.

Market Direction Technical Indicators of Dec 27 2012 at the close
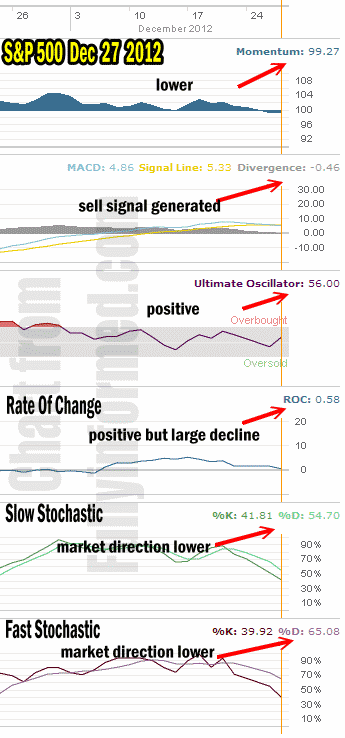
For Momentum I am using the 10 period. Momentum is now negative.
For MACD Histogram I am using the Fast Points set at 13, Slow Points at 26 and Smoothing at 9. MACD (Moving Averages Convergence / Divergence) is negative and today issued a sell signal.
The Ultimate Oscillator settings are Period 1 is 5, Period 2 is 10, Period 3 is 15, Factor 1 is 4, Factor 2 is 2 and Factor 3 is 1. These are not the default settings but are the settings I use with the S&P 500 chart set for 1 to 3 months.
The Ultimate Oscillator is still positive and rebounded slightly from yesterday.
Rate Of Change is set for a 10 period. Rate Of Change has fallen significantly over the past three trading sessions and is now almost negative.
For the Slow Stochastic I use the K period of 14 and D period of 3. The Slow Stochastic is indicating more downside is ahead.
For the Fast Stochastic I use the K period of 20 and D period of 5. These are not default settings but settings I set for the 1 to 3 month S&P 500 chart when it is set for daily. The Fast Stochastic is indicating a strong downside momentum is building.
Market Direction Outlook And Strategy From Dec 28 2012
The market direction outlook for Dec 28 2012 is negative. The technical indicators are all warning that investor uncertainty is reaching a level of serious concern. Meanwhile the sell signal from MACD is enough to warrant holding cash back from further Put Selling opportunities until the market shakes out from here. I believe any rally from a resolution will be followed by a retest of, at the least, the lows seen today.
It is rare when a market direction change occurs like today and there is no further retest of the lows. I will be cautious will my capital until the market direction becomes clear. The fiscal cliff remains the primary focus of all investments at this point. It is foolish to try to judge the direction stocks may take without a clearer picture of what the President and/or the House and Senate decide to do.
Market Direction then for tomorrow is for stocks to be lower. A resolution will rally stocks but such a rally should be traded and not bought into as I believe stocks will retest at least the lows seen earlier today.
Internal Market Direction Links
