Market Direction on Friday was down but I thought not as low as you would have expected considering the fiscal cliff news. One of the more interesting aspects of Friday’s market direction action was the Toronto Stock Exchange closed almost unchanged. When a market is in panic it affects market direction similarly around the world. This was not the case on Friday which shows that investors are undecided on the fiscal cliff issue. Most investors still believe a resolution will occur perhaps in January and the rebound in the afternoon shows investor confidence while shaken, remains.
Market Direction and Hoping For Santa
This week mark’s the beginning of the Santa Claus rally. This phenomena of the last few trading days of December and first few of January has produced a 1.5% gain since 1950 for the last week of December and since 1969 a 1.6% gain. In more cases than I would like to mention, if there is no rally, a bear market has ensued in 85% of the time. Let’s hope this year Santa still comes to town.
Market Direction Close on Friday
At the closed the S&P 500 was down 0.9 percent at 1430.15 and the Dow was down the same percent at 13190.84. During the day one of the best trades was in US treasury bonds which were down 1.76 percent and investors still fled to their perceived safety. Incredible to think that even at the low yields we are presently at, investors can still push the yield lower when they become worried about stocks.
Market Direction and the VIX Index
Another interesting event on Friday was the VIX Index which rose during the day to its highest level since July and then ended almost unchanged.
Economic Conditions
The decline in stocks was followed by an upbeat reading on US durable goods orders in November. Orders rose 0.7 per cent, beating analysts estimates for a gain of just 0.3 percent. On the downside the University of Michigan confidence index fell to 72.9 from 74.5.
Research In Motion Stock
One of the more interesting developments in Stock was the drop of RIM Stock of over 22% on the day. Earnings although still a loss were better than expected but the announcement of RIM that new services fees would be introduced hit the stock hard.
Market Direction Technical Indicators of Dec 21
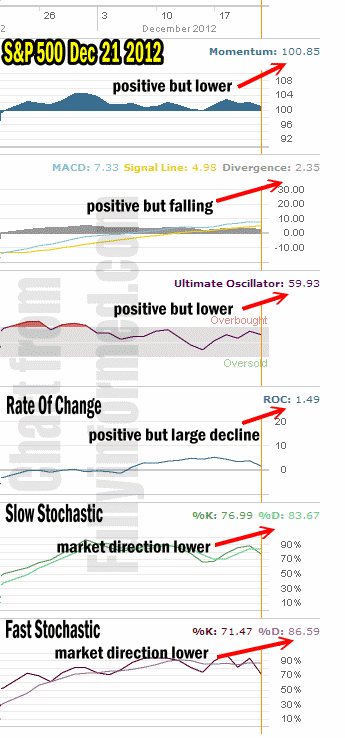
Monday Dec 24 is a short day so it may prove quiet. Nonetheless let’s see how the market direction decline on Friday impacted the market timing technical indicators and see what they forecast for market direction for Christmas Eve.

Market Direction technical indicators of Dec 21 2012 at the close
For Momentum I am using the 10 period. Momentum is still positive but the selling has turned momentum lower. Still though it is positive.
For MACD Histogram I am using the Fast Points set at 13, Slow Points at 26 and Smoothing at 9. MACD (Moving Averages Convergence / Divergence) is still positive but it fell on Friday’s market action. The fall was more than expected for a decline of 120 points. It was the original decline in the early morning that weighed heavily on MACD. This could be a signal that the recent rally is in trouble.
The Ultimate Oscillator settings are Period 1 is 5, Period 2 is 10, Period 3 is 15, Factor 1 is 4, Factor 2 is 2 and Factor 3 is 1. These are not the default settings but are the settings I use with the S&P 500 chart set for 1 to 3 months.
The Ultimate Oscillator is still positive and despite the large drop on Friday it remains almost unchanged from Thursday. The Ultimate Oscillator is signaling that confidence in the rally continuing remains consistent among investors.
Rate Of Change is set for a 21 period. Rate Of Change is still positive but similar to MACD, the large decline in the rate of change is a signal worth watching. At present it may be signaling that the rally is about to end.
For the Slow Stochastic I use the K period of 14 and D period of 3. The Slow Stochastic is no longer overbought. The signal is for market direction down.
For the Fast Stochastic I use the K period of 20 and D period of 5. These are not default settings but settings I set for the 1 to 3 month S&P 500 chart when it is set for daily. The Fast Stochastic is also signaling that the market direction is down.
Market Direction Outlook And Strategy
Friday may not at first glance appear to be going to change market direction up. However there are some cautious signals once again in the S&P 500 market direction technical indicators. MACD, Rate Of Change, Momentum, Slow Stochastic and Fast Stochastic are all sending a signal that the trend could change.
Market Direction up still has strength left and the Ultimate Oscillator is the main market timing indicator that is supporting a move back to a higher level during the week. However on Monday the chance of the market direction climbing substantially higher appears to be poor. Market direction on Monday may be lower but this is the start of the Santa Claus Rally period and that has to be taken into account.
Market Direction then for Monday appears to be lower than Friday’s close. Nothing substantially lower is expected and the Santa Claus Rally period could surprise to the upside. There are no clear signals to say that the recent recovery in the market direction is over and the trend is changing back to down. There are though enough caution signals to warrant being careful this week for selecting Put Selling opportunities. Any Put Selling I will be doing this week will be few and only on stocks that have dipped. However the Santa Claus rally could be followed by more selling, particularly if the fiscal cliff remains unresolved.
Internal Market Direction Links
