The market direction outlook for Friday was for stocks to consolidate and continue to move higher. Stocks though pushed higher on the better than expected GDP news. As well investors are still pleased with the Fed announcement on Wednesday, as they stay focused on the Fed promise of next to zero interest rates into 2016. Many investors are looking at this news as a “guarantee” of higher returns in stocks for another two years. That could be a mistake but until the technical indicators point to any kind of larger correction, investors are going to stay “believers”. Friday saw heavier volume and market breadth was strong with 5 stocks up to every 2 down. With 2013 on track to providing the best gains since 1997, more capital appears poised to move into stocks.
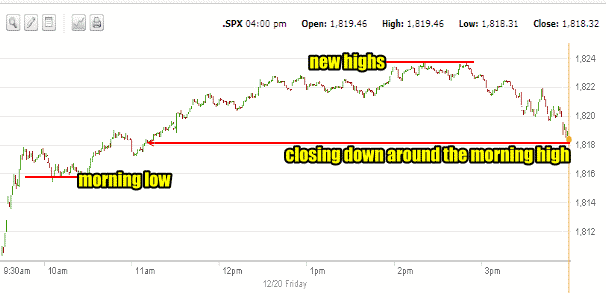
Market Direction S&P 500 Intraday For Dec 20 2013
Friday’s market direction was interesting. The morning opened with a push higher. Then a short period with a morning low was put in by 10:00 to 10:30. The morning low was not very deep which inspired investors to push harder and by the late afternoon the market direction had pushed to another new high. Investors in the last hour though sold the market high back off perhaps due to not wanting to hold over the weekend. The closing was down near the morning high at 1818.

Advance Declines For Dec 20 2013
73% of stocks advanced pm Friday with 24% declining. New highs however were at 286 versus just 91 new lows. The number of new highs climbing is a good sign of the market moving higher. If there will be a Santa Claus rally in the upcoming week the new highs will rise considerably. This is one of the signals I am watching as we enter the week of Christmas.
Market Direction Closings For Dec 20 2013
The S&P closed at 1818.32 up 8.72. The Dow closed at 16,221.14 up 42.06. The NASDAQ closed at 4104.74 up 46.61.
The IWM ETF closed at 113.93 up 1.89 and setting another new intraday high at 114.22.
Market Direction Technical Indicators At The Close of Dec 20 2013
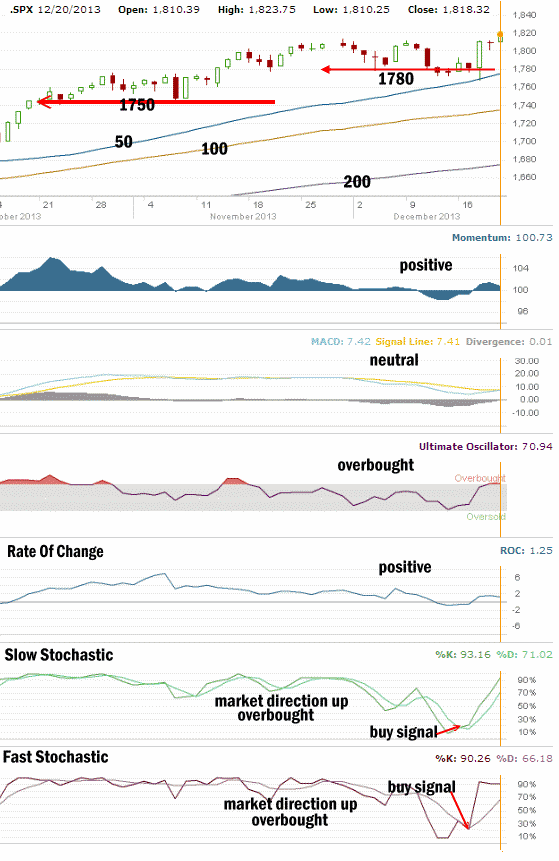
Let’s review the market direction technical indicators at the close of Dec 20 2013 on the S&P 500 and view the market direction outlook for Dec 23 2013.

The most important support line in the S&P 500 at this time remains at 1750. That support line is holding the market direction up at present and that has not changed. The second support level of 1780 is very light support and there is no level of support above 1780 at present.
For Momentum I am using the 10 period. Momentum has been the best indicator during this recent correction. Momentum is positive although it moved lower on Friday.
For MACD Histogram I am using the Fast Points set at 13, Slow Points at 26 and Smoothing at 9. MACD (Moving Averages Convergence / Divergence) issued a weak sell signal on Friday Nov 29 when MACD was slightly negative. As of Dec 20 the reading is neutral which is an excellent recovery from last week’s sell signal.
The Ultimate Oscillator settings are Period 1 is 5, Period 2 is 10, Period 3 is 15, Factor 1 is 4, Factor 2 is 2 and Factor 3 is 1. These are not the default settings but are the settings I use with the S&P 500 chart set for 1 to 3 months.
The Ultimate Oscillator is overbought for the third day.
Rate Of Change is set for a 21 period. The Rate Of Change is positive for the third day and continues to show strength.
For the Slow Stochastic I use the K period of 14 and D period of 3. The Slow Stochastic issued a buy signal on Wednesday and is still indicating that more upside lies ahead for this week. The Slow Stochastic is overbought.
For the Fast Stochastic I use the K period of 20 and D period of 5. These are not default settings but settings I set for the 1 to 3 month S&P 500 chart when it is set for daily. On Wednesday last week the Fast Stochastic issued a buy signal. It is now overbought but continues to point to a higher day on Monday.
Market Direction Outlook And Strategy for Dec 23 2013
This is the short week of Christmas trading. Volumes normally are lighter and after Christmas we may see the traditi0nal Santa Claus rally taking the market into the new year. Friday’s action was not overly encouraging for the start of Monday. The sell-off into the close saw both the Dow and the S&P shed a lot of points. While this could have been investors worried about holding positions over the weekend, it could also signal some weakness for Monday morning.
Overall though I think the market direction has enough strength to end positive once more on Monday. Any weakness in my favorite stocks and I will look for more opportunities to sell put options. I am expecting a strong finish to the end of the year.
I believe the market direction to start on Monday could see weakness but I am expecting any dip to be bought and the day to see stocks end higher. Monday and Tuesday could see the market setting the ground work for another Santa Claus rally.
Market Direction Internal Links
Profiting From Understanding Market Direction (Articles Index)
Understanding Short-Term Signals
Market Direction Portfolio Trades (Members)
Market Direction External Links
Market Direction IWM ETF Russell 2000 Fund Info
Market Direction SPY ETF 500 Fund Info
