The market direction outlook for Wednesday was for the market direction to stay weak but more sideways than down. At the most I would have expected much of what we saw on Tuesday. Instead investors were spooked once again by the fear of early tapering by the Federal Reserve. It does seem strange that an improving economy would be scary to investors who worry that the end of the Fed liquidity means an end to the rally in stocks. I would hardly imagine the Fed would pull out all the Quantitative Easing aspects. tapering means just that, a gradual reduction in the Fed dollars being pumped into what is basically the mortgage program. But as explained many times in my posts, it is emotion that drives stocks up and down and today was an emotional down day. Let’s look at today’s market action.
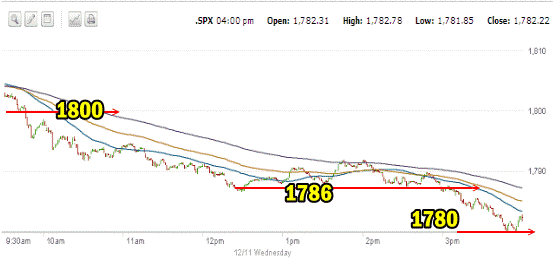
Market Direction S&P 500 Intraday For Dec 11 2013
The market direction opened weak and within minutes fell below 1800. There is no support at 1800 and naturally the move down was quick and decisive. The market moved all the way to 1786 by lunch hour and then with only a small rally to try to support 1786, the market direction gave up around 3:00 PM and pushed down to the first level of support at 1780. It bounced off 1780 twice in the last few minutes of the day and closed just above it.
If 1780 breaks tomorrow the market will move quickly toward the next support level of 1750. That level is key to the rally. If it breaks it ends support that goes back to mid-October. In my opinion that will end the rally for 2013. That does not mean we cannot have the traditional Santa Claus rally in the final week of December but the rally will be from a much lower level.

Advance Declines For Dec 11 2013
Today was all about declining issues. 83% of stocks were declining and only 16% advancing. 184 stocks made new 52 week lows while just 59 made new highs. These are very disappointing numbers and show that investors in general joined in the selling as the day wore on. Again, stocks are an emotional investment and as you can see from the numbers, when selling starts and investors worry, they join in and begin selling.
Market Direction Closing For Dec 11 2013
All the indexes experienced heavier than usual volumes as selling was the order of the day. The S&P 500 closed at 1,782.22 down 20.40. The Dow closed at 15,843.53 down 129.60. The NASDAQ closed at 4003.81 down 56.68 and ready to fall back below 4000. IWM ETF closed at 109.60 down 1.83 for a loss of 1.64%.
Market Direction Technical Indicators At The Close of Dec 11 2013
Let’s review the market direction technical indicators at the close of Dec 11 2013 on the S&P 500 and view the market direction outlook for Dec 12 2013.

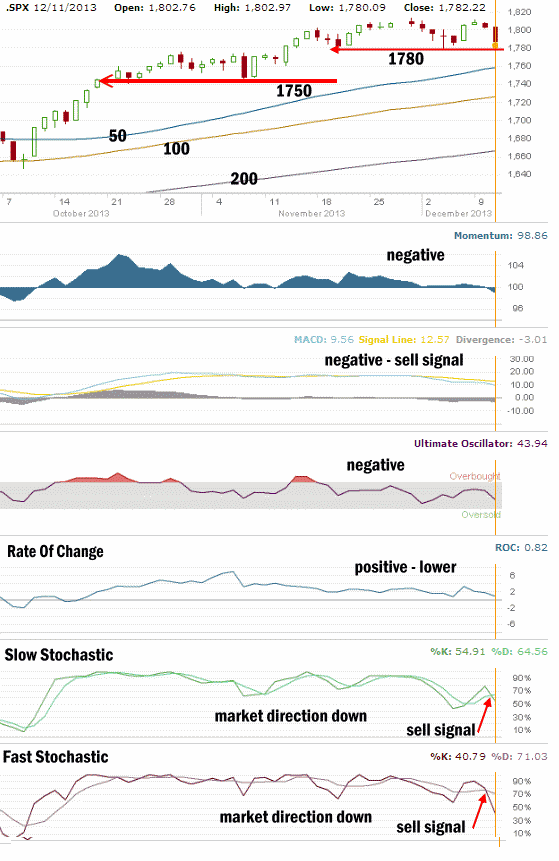
The most important support line in the S&P 500 at this time in the ongoing rally is still 1750. That support line is holding the market direction up at present and that has not changed. As explained in yesterday’s outlook, 1780 is important. While it is not strong support, a break of 1780 is an indication that this rally has probably run its course. When 1780 breaks, the next move will move the market direction down to 1750. There are of course catalysts that can push stocks higher but at present I think about the only two things that can keep the rally moving is either the Fed not tapering in December and making that clear, or the Fed outlining when it will begin to taper to take away uncertainty from the market.
For Momentum I am using the 10 period. Momentum has been the best indicator during this recent correction. Today momentum was negative and looks to be building more to the downside.
For MACD Histogram I am using the Fast Points set at 13, Slow Points at 26 and Smoothing at 9. MACD (Moving Averages Convergence / Divergence) issued a weak sell signal on Friday Nov 29 when MACD was slightly negative. It would now appear that once again MACD was indeed accurate back on November 29 when it issued a sell signal on the market. The move today in MACD is for a stronger negative reading indicating more downside lies ahead.
The Ultimate Oscillator settings are Period 1 is 5, Period 2 is 10, Period 3 is 15, Factor 1 is 4, Factor 2 is 2 and Factor 3 is 1. These are not the default settings but are the settings I use with the S&P 500 chart set for 1 to 3 months.
The Ultimate Oscillator fell quickly today and is back negative indicating more downside is ahead for stocks.
Rate Of Change is set for a 21 period. The Rate Of Change is still positive but fell further today than in the past few days indicating a growing lack of interest in owning stocks at present.
For the Slow Stochastic I use the K period of 14 and D period of 3. The Slow Stochastic is signaling that the market direction is down. The buy signal on Tuesday was never confirmed and today we can see a sell signal which now needs to be confirmed.
For the Fast Stochastic I use the K period of 20 and D period of 5. These are not default settings but settings I set for the 1 to 3 month S&P 500 chart when it is set for daily. Yesterday the Fast Stochastic had signaled that the market direction was up but only slightly and the buy signal was in jeopardy. I indicated yesterday that the Fast Stochastic was on the verge of turning negative and issuing a sell signal. Today we got that sell signal and the Fast Stochastic is now signaling that tomorrow will see stocks move lower. If that happens it will confirm the sell signal for stocks.
Market Direction Outlook And Strategy for Dec 12 2013
In my outlook and strategy comments yesterday I indicated that momentum was terrible and ready to turn negative. I indicated the MACD was still indicating stocks would head lower. I discussed the rate of change showing a lack of buying interest and that the Fast Stochastic was on the verge of issues a short-term sell signal. As also mentioned yesterday, it really does come down to the Federal Reserve Chairman and when tapering for stocks will begin. But there are other issues as well. The wide-spread believe even among many so-called perma-bears that the market would push higher is never a good sign for stocks. Add in the year-end window dressing when billions were poured into stocks in a short time and pushed them to new highs making most of them overvalued and you have the making of a decline.
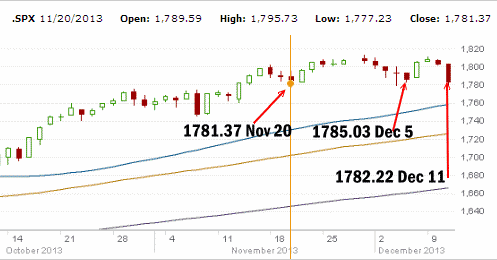
If we look at the S&P 500 below you can see that on Nov 20 the close was 1781.37 before stocks rallied for just a few days. The next closing low was 1785.03 on Dec 5. Today’s close placed the S&P at 1782.22 below the Dec 5 closing low and just above the Nov 20 closing low. This will not be the area to watch. Should the S&P close below 1781.37 we will have set up a new lower low. If no rally resumes, then the market direction will quickly fall to 1750 which is the next level of support. If 1750 breaks then the rally is over in my opinion.

My outlook yesterday was not negative enough. While I did believe we would see a weak day with a negative close, I also felt that investors might be tempted to try to pick up some stocks. That obviously did not happen. Many stocks fell more than anticipated today as buyers slipped away forcing stocks lower, looking for buyers.
I see no reason for selling puts today and I did not sell any. I also did not roll down any puts either. I want another day to see what the market may do on Thursday. The rally of last Friday is over and failed. This marks the second failure of the rally higher since mid-November. A lot of what we may see next depends on the Federal Reserve and I am sure Bernanke is aware of what could happen to the market without some kind of direction from the Federal Reserve.
For tomorrow I am not expecting another big decline but it never hurts to be ready. I will roll down some puts if they end up at the money or in the money on my stocks. The trend is still up until it is broken. But this last little rally looks terrible on the charts which could mean a more severe pullback is in the works which will move the market down to the 50 day simple moving average (SMA). There is a lot of like about the present market but the constant chatter from analysts about how stocks still “have room to climb” and are not “fully valued” and my favorite “still not quite overvalued”, has not been helpful for a lot of investors over the past couple of months.
When selling puts over the past few weeks I have taken on smaller positions when selling puts. As well I have turned to the Put Selling ladder strategy in stocks like Microsoft to continue to earn income but provide better risk management. By taking on less put contracts when I have sold put options, I am leaving myself with more capital than usual in the hope that if stocks do pull lower I will be able to sell puts at lower levels but for better premiums.
For tomorrow then, stocks are set to move lower. I think it’s a bit too early for bargain hunting for many investors which is why I think stocks could slide 75 to 90 points on the Dow before moving sideways. I am expecting a close tomorrow down perhaps 40 to 60 points on the Dow and I am was hoping the S&P closes at or above 1781.37 but I don’t think it will. I do believe there is enough weakness that the S&P will fall to below 1780 and close below it. That may set the market direction up for further downside and a test of 1750 this month. Let’s see what the Fed plans are shortly.
Market Direction Internal Links
Profiting From Understanding Market Direction (Articles Index)
Understanding Short-Term Signals
Market Direction Portfolio Trades (Members)
Market Direction External Links
Market Direction IWM ETF Russell 2000 Fund Info
Market Direction SPY ETF 500 Fund Info
