The market direction outlook for Tuesday was for at least a marginal gain to show a continued effort to follow through on Friday’s gains. That didn’t happen although the losses were slight. Instead the major concern again is the Fed tapering question. Whether tapering occurs this month is an unknown component and investors hate the unknown. With this now forefront, the news of a budget deal may help tomorrow but the deal has to be ratified and it has nothing to do with the debt ceiling which looms for January but hopefully will be resolved if the budget deal is passed. Meanwhile the news that the budget deal will save $26 billion was applauded but honestly, $26 billion with a national debt of over 17 trillion dollars?
Market Direction S&P 500 Intraday For Dec 10 2013
The market direction opened weak. After three small pull backs at the outset the market direction shifted to up but the market was unable to get any real momentum going. It therefore turned lower and broke through the morning low of 1804.50. For the rest of the day the market meandered back and forth over the 1804.50 valuation. I had hoped the market would close around that valuation but unfortunately right at the end investors sold the market lower to close at $102.62.

The NASDAQ Market Direction
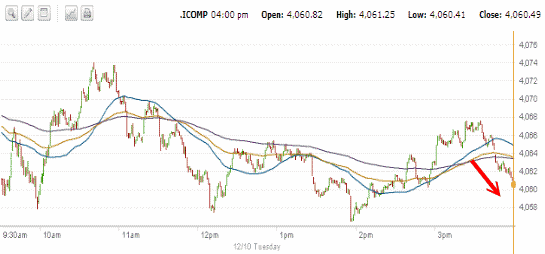
I usually follow the S&P on a daily basis but I also do take time out to look at the other indexes. I thought I would share what I saw with the NASDAQ today. The morning open saw the NASDAQ open higher and then push up to the 4080 level before selling lower. From there though, investors did not try to retest the 4080 level again. Unlike the S&P, investors stayed trading in a very tight range on many stocks. This kept the NASDAQ index in a sideways pattern for most of the day. By mid-afternoon the NASDAQ also started to fade, just as the other two indexes did. But the move lower was small and the close saw the NASDAQ with a very slight jump which kept the index positive into the close. With the NASDAQ still leading stocks it was nice to see this index not give back much ground today. The loss was only about a quarter of a percent which is nothing but the negative aspect of today’s movement coupled with yesterday’s poor showing is disappointing.

All the Indexes performed the same with selling into the close. This is something we saw last week when the markets were selling lower.

NASDAQ Index sold off into the close
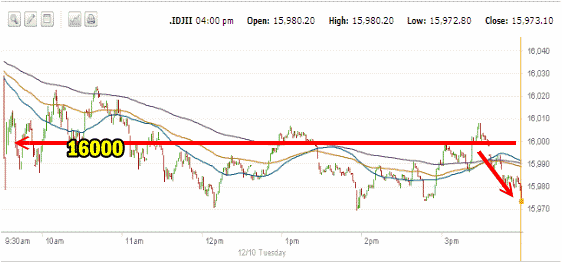
The Dow’s performance was poorer than the other two indexes. For much of the day it wandered around the 16000 level but without any conviction. The close was identical with investors selling to end the day.

The Dow sold off into the close as well.
Advance Declines For Dec 10 2013
Declining issues were ahead of advancers as 59% of all stocks were declining while 38% were advancing. 111 stocks made new highs while 118 made new lows.
Market Direction Closing For Dec 10 2013
The S&P 500 closed at 1,802.62 down 5.75 and still clinging to 1800. The Dow closed at 15,973.13 down 52.40. The NASDAQ closed at 4060.49 down 8.26. IWM ETF closed at 111.43 down 1.02 for a decline of 0.91%.
Market Direction Technical Indicators At The Close of Dec 10 2013
Let’s review the market direction technical indicators at the close of Dec 10 2013 on the S&P 500 and view the market direction outlook for Dec 11 2013.

The most important support line in the S&P 500 at this time in the ongoing rally is still 1750. That support line is holding the market direction up at present and that has not changed. The bounce back on Friday established a second level of support at 1780 which while light, is nonetheless technically important. The market direction in this last little correction reached 1779.09 intraday on Dec 4 but still closed above 1780. Technically then 1780 was not broken by this correction. 1780 has become support. Any move lower by the S&P 500 should stop around the 1780 level. I am not expecting a move lower but should it occur it is important that the 1780 level is not broken. If it breaks then the present rally is over.
For Momentum I am using the 10 period. Momentum has been the best indicator during this recent correction. Today momentum was slightly lower and on the verge of turning negative.
For MACD Histogram I am using the Fast Points set at 13, Slow Points at 26 and Smoothing at 9. MACD (Moving Averages Convergence / Divergence) issued a weak sell signal on Friday Nov 29 when MACD was slightly negative. MACD is still negative again today and gave the exact same reading as Monday.
The Ultimate Oscillator settings are Period 1 is 5, Period 2 is 10, Period 3 is 15, Factor 1 is 4, Factor 2 is 2 and Factor 3 is 1. These are not the default settings but are the settings I use with the S&P 500 chart set for 1 to 3 months.
The Ultimate Oscillator is still in positive territory but moving sideways, which at present is fine and supports a push higher.
Rate Of Change is set for a 21 period. The Rate Of Change is still positive but once again pulled back reflecting the mixed day for stocks.
For the Slow Stochastic I use the K period of 14 and D period of 3. The Slow Stochastic is signaling that the market direction is up and it gave a buy signal on Tueday.
For the Fast Stochastic I use the K period of 20 and D period of 5. These are not default settings but settings I set for the 1 to 3 month S&P 500 chart when it is set for daily. The Fast Stochastic is signaling that the market direction is up and issued a buy signal on Friday however that buy signal is in jeopardy. The Fast Stochastic is on the verge of turning lower which will issue a short-term sell signal if that occurs.
Market Direction Outlook And Strategy for Dec 11 2013
Will the Fed or won’t the Fed. That remains the question for investors. Back on Friday with a gain of almost 200 points, investors seemed to be telling the Fed that they were not concerned. Now with the information out of China and the recent GDP numbers out of the US, investors are worried again. But the numbers out of China do not show a robust booming economy. Instead exports were stellar but imports extremely poor.
The market direction technical indicators cannot take into account the upcoming Fed action. They can only gauge the mood or sentiment of investors. At present the sentiment is weak again. The technical indicators are still predominantly positive but there are lots of warning signs. Momentum is terrible and ready to turn negative. MACD is still signaling market direction lower. The Fast Stochastic is ready to issue a short-term sell signal. Rate of Change shows a lack of interest among investors. All of this is underway while the market is sitting at all time highs. While not unusual you can see in the chart below that momentum is slowing and the last few weeks has seen the market experience trouble breaking decisively through the 1800 level. The S&P is struggling a bit here but a lot of the problem is the Fed uncertainty.

At the same time if we look at momentum for 2013 you can see that each of the rallies had better momentum. This latest movement after the short correction has not had a lot of momentum behind it. Further, you can see that besides low momentum, the last week it is flat. If you look at periods of flat momentum, they most often are followed by negative momentum which means a correction which can be shallow or deep.
The lack of momentum over the past week is a definite and growing concern.

For tomorrow then the technical indicators are a bit mixed but they are warning that there could be more weakness. If the Fed at this point should decide to taper in December I believe it will see a pull back in stocks. At some point though the Fed will have to scale back and slowly work their way out of these liquidity type programs. That means that eventually stocks will undergo a change with the Fed support being scaled back.
For tomorrow then I do not see a big change in what we have experienced over the past two days. I am expecting another weak day tomorrow and another possible negative closing as investors continue to worry about possible Fed actions. Remember though, the selling today was muted which could mean after two days of sideways investors may want to pick up a few stocks and if that happens the direction could end on the positive side.
Market Direction Internal Links
Profiting From Understanding Market Direction (Articles Index)
Understanding Short-Term Signals
Market Direction Portfolio Trades (Members)
Market Direction External Links
Market Direction IWM ETF Russell 2000 Fund Info
Market Direction SPY ETF 500 Fund Info
