On the weekend I wrote how Monday would be a pivotal day. The market direction had to show follow through from Friday which is something this market in February has continually been unable to do. While analysts can talk about Italy and the Euro and all kinds of other factors, the true aspect of the present market direction is that the Dow has repeatedly been unable to break through 14000. While 14000 itself is not any special number, it does mark a high level for the Dow 30 stocks to reach. As everyone knows the only way that the Dow 30 can reach 14000 is for the underlying securities to all rise in valuation.
In 2007 when the Dow reached 14000 and pushed beyond, I had indicated since 13500 that the Dow 30 stocks in general were overvalued. As those stocks continued to climb they basically were becoming even more overvalued. Investors are an enthusiastic bunch when they think stocks are going higher and they keep buying far into overvalued territory.
Market Direction On The Dow in 2013
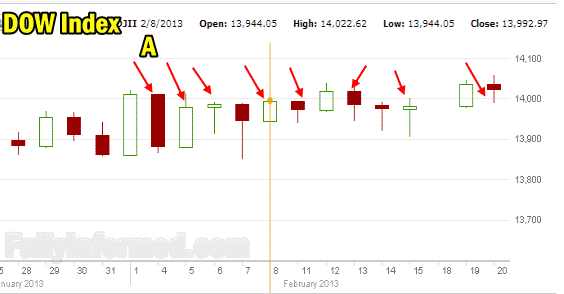
Now we are in 2013 and the Dow 30 stocks have pushed the index all the way to 14000. But even as earnings came in above expectations on over 60% of stocks, most stocks are fully and in many cases overvalued placing pressure on the market direction up. Investors have become nervous as the chart for February in the Dow below shows the inability of the index to capture and then move beyond 14000. This chart is from my article on market direction on Feb 20 in which I warned that market direction was not going to be able to move higher without a strong catalyst.

Market Direction on the Dow to Feb 20 2013
Therefore, despite what you read the real problem right now is stocks are in general fully valued and in many cases overvalued. There needs to be a catalyst to move stocks higher in a convincing fashion to break through 14000 on the Dow and 1500 on the S&P for more than a couple of weeks.
Presently with everything from the budget battle and Fed waffling on their QE policy to Europe and the rise of the US dollar worrying investors, the need for a catalyst is even greater. Without it the sell-off was bound to happen.
Support Levels in Market Direction
It is important to remember that this is a bull market and corrections happen all the time in bull markets. A normal correction can be anywhere from 3% to 15%. Personally I think the correction should be small with the S&P perhaps falling back to 1475 from 1500. This would bring the S&P 500 back to the 50 day moving average which would be very appropriate for a correction. Often within a bull market the index will pull back to test for support at the 50 day moving average. This is normal and provides good Put Selling opportunities as well as trade entry positions.
That though is a guess and it is better to look at the market direction technical indicators to see what they are saying each day, rather than guess where a bottom may lie.
Market Direction Closings
Before going further let’s look at today’s closing numbers. The S&P 500 closed at 1487.85 down 27.75 points and breaking once again the 1500 level. The Dow closed at 13784.17 down 216.40 points closing strongly below the 14000 level. The NASDAQ closed at 3116.25 down 45.57 points which includes a strong drop by Apple Stock to $443.61.
Market Direction Technical Indicators At The Close of Feb 25 2013
Let’s take a moment now and review the market direction technical indicators at today’s close on the S&P 500 and view the next trading day’s outlook.

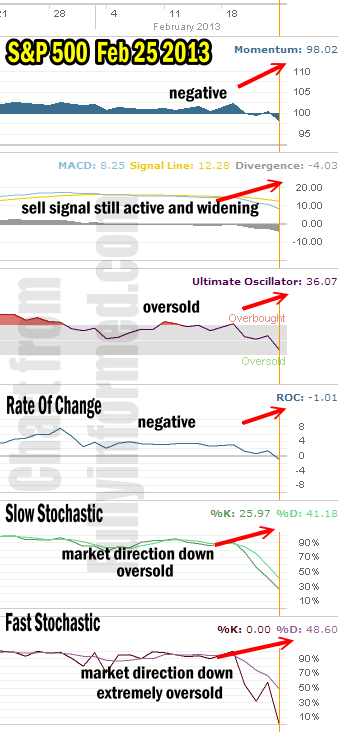
Market Direction Technical Indicators for Feb 25 2013
For Momentum I am using the 10 period. Momentum is negative and falling rapidly.
For MACD Histogram I am using the Fast Points set at 13, Slow Points at 26 and Smoothing at 9. MACD (Moving Averages Convergence / Divergence) issued a sell signal on the S&P 500 on Feb 4 when the S&P 500 was at 1495.71. That sell signal has never wavered and now the S&P has closed below 1495.71 confirming the sell signal. Meanwhile the sell signal has gained strength predicting that the market direction will move lower before closing at another new high.
The Ultimate Oscillator settings are Period 1 is 5, Period 2 is 10, Period 3 is 15, Factor 1 is 4, Factor 2 is 2 and Factor 3 is 1. These are not the default settings but are the settings I use with the S&P 500 chart set for 1 to 3 months.
The Ultimate Oscillator by the close of selling is oversold indicating how quickly the sentiment changed in the last hour or so of trading today. On Friday the sentiment was bullish as investors decided to buy. Today by mid-day they were getting out.
Rate Of Change is set for a 21 period. Rate Of Change is now negative for the first time since December 28 2012.
For the Slow Stochastic I use the K period of 14 and D period of 3. The Slow Stochastic is oversold but not to the extreme. It continues to predict that the market direction will be lower as the week progresses. This means any bounce back tomorrow has to be ignored as the slow stochastic is definitely warning that lower prices are ahead.
For the Fast Stochastic I use the K period of 20 and D period of 5. These are not default settings but settings I set for the 1 to 3 month S&P 500 chart when it is set for daily. The Fast Stochastic is now extremely oversold but indicating there is more room to the downside still ahead.
Market Direction Outlook And Strategy for Feb 26 2013
The market direction outlook for the next trading day is for a possible bounce back in the morning and then sideways to down for much of the day. This is the final week of February and often it is the weakest of the best 6 months of the year. Obviously this February is not going to be any different.
The market direction down is obvious at this point. The market cannot have a large down day and then big up day and then another large down day without doing technical damage as you can see in the technical indicators above. These types of whipsaw also hurts investor confidence which assists in pushing the overall market direction lower as investors worry about any bounce back and tend to sell in it.
What investors will be looking for now is for the market direction to fall back, bottom and test for support. Once investors see that support is actually in place, they will return and place more capital to work, but until then look for market direction to stay weak and suspect every rally.
The strategy I have used is to stay invested and to stay cautious. I have taken smaller positions than normal in most stocks and stayed out of the money. All of my positions are monitored and closed for profits when at least 75% of the profit is available, but it is important to understand that in a declining market personal judgement has to be used when deciding on just how much profit is enough to close for if a stock looks like it will move lower.
By selling smaller positions throughout the latter half of January and all of February this leaves lots of room to sell puts lower should many of my stocks fall lower. This averages my naked puts lower including those caught in the money. The advantage of cash is obvious. This remains a bull market despite any doom and gloom the media presents after today’s selling. That means opportunities need to be taken when they present themselves and strategies need to be put in place to take advantage of the market direction as it moves lower and then recovers.
The strategy is unchanged at staying cautious and staying invested. Take smaller positions and close for good profits when the opportunity presents itself. Profit to the downside by staying with the trend on the market direction when doing Stock Market Trading strategies. This means don’t bet against the trend. Investing isn’t gambling. When the market direction trend is lower stack the odds of success in your favor by investing with the trend and not against it. This means be leary of buying calls and trading toward the upside but instead consider strategies like my Spy Put Options, which I trade when the market direction is clearly down.
Internal Market Direction Links
Profiting From Understanding Market Direction (Articles Index)
Understanding Short-Term Signals
Market Direction Candlestick Daily View (Members only)
Market Direction Portfolio Ongoing Trades (Members only)
Market Direction External Links
Market Direction IWM ETF Russell 2000 Fund Info
Market Direction SPY ETF 500 Fund Info
.
