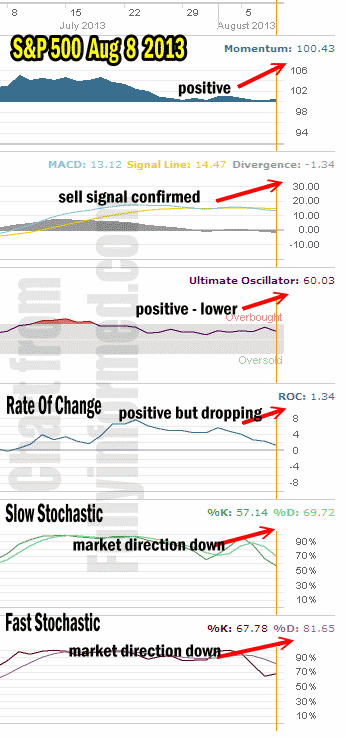
The Market direction outlook for Thursday was for the market to rebound. While the morning was weak the market managed a nice recovery as the day wore on. The question though is whether this was a technical rebound after a few days of selling or something more. My personal opinion is that the market has a lot more strength than analysts and media pundits are aware of. The technicals continue to look reasonable for the market direction to resume a push higher. Let’s take a look at the market direction technical indicators for a better picture.
Market Direction Closing For Aug 8 2013
The S&P 500 closed at 1,697.48 up 6. The Dow closed at 15,498.32 up 27.65. The NASDAQ closed at 3,669.12 up 15.12.
Market Direction Technical Indicators At The Close of Aug 8 2013
Let’s review the market direction technical indicators at the close of Aug 8 2013 on the S&P 500 and view the market direction outlook for Aug 9 2013.
For Momentum I am using the 10 period. Momentum continues to not turn negative although it is just slightly positive.
For MACD Histogram I am using the Fast Points set at 13, Slow Points at 26 and Smoothing at 9. MACD (Moving Averages Convergence / Divergence) issued a weak sell signal on July 31 which was confirmed August 7. Today the sell signal continued to climb.
The Ultimate Oscillator settings are Period 1 is 5, Period 2 is 10, Period 3 is 15, Factor 1 is 4, Factor 2 is 2 and Factor 3 is 1. These are not the default settings but are the settings I use with the S&P 500 chart set for 1 to 3 months.
The Ultimate Oscillator is still positive abut turning slightly lower.
Rate Of Change is set for a 21 period. The rate of change is positive is continuing to drop.
For the Slow Stochastic I use the K period of 14 and D period of 3. The Slow Stochastic is signaling that the market direction is definitely lower.
For the Fast Stochastic I use the K period of 20 and D period of 5. These are not default settings but settings I set for the 1 to 3 month S&P 500 chart when it is set for daily. The Fast Stochastic is indicating that the market direction is down again for tomorrow.
Market Direction Outlook And Strategy for Aug 9 2013
For Friday the majority of the market direction technical indicators are pointing to the market direction turning down once again. If this does occur then Thursday’s rebound was simply technical in nature. Personally I think there is enough strength among bullish investors to keep pushing stocks back up. I sold puts today on BCE Stock and I found that my BNS Stock purchase from Thursday looks set to bounce back for the second time in just a few weeks.
For Friday the market direction looks ready to pull back again which could be be a retest of Wednesday’s lows before the market direction tries to recover back up.
Market Direction Internal Links
Profiting From Understanding Market Direction (Articles Index)
Understanding Short-Term Signals
Market Direction Portfolio Trades (Members)
Market Direction External Links
Market Direction IWM ETF Russell 2000 Fund Info
Market Direction SPY ETF 500 Fund Info

