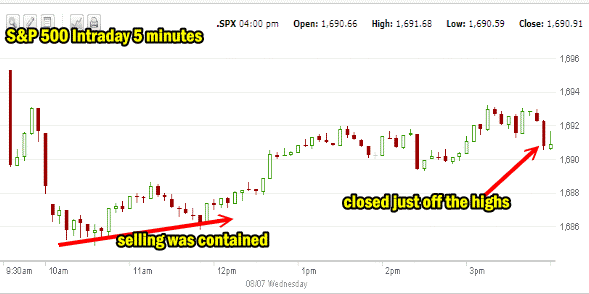
Market direction at the outset worried investors as the morning saw sellers push the market direction lower. But by 10:00 am, just half an hour into the open, the low was in and the selling was contained. From there the market direction spent the rest of the day pushing higher and at one point in the later afternoon the S&P was actually positive. In the end themarket closed just off the highs but recovered all the losses from the morning. This was quite the feat and continues to show strength that underlies this market and keeps the direction lower in check.
Market Direction Intraday Chart
You can see today’s acti0n in the market direction chart set for 5 minutes below. The morning selling within the first half hour presented the best put selling opportunities on most of the stocks that I keep on my watch list. By 1:00 PM themarket direction had reached the highs that would close the market direction at the end of the day.
Market Direction Closing For Aug 7 2013
The S&P 500 closed at 1,690.91 essentially flat. The Dow closed at 15,470.67 down 48.07. The NASDAQ closed at 3,654.01 also flat.
Market Direction Technical Indicators At The Close of Aug 7 2013
Let’s review the market direction technical indicators at the close of Aug 7 2013 on the S&P 500 and view the market direction outlook for Aug 8 2013.
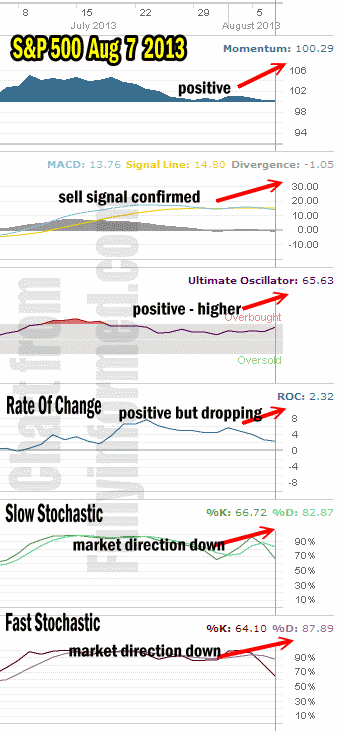
For Momentum I am using the 10 period. Momentum is essentially clinging to remain positive. But after threedays of selling you would think it would finally be negative but that is not the case. Because of this the move lower remains suspect which is part of the reason I picked the support level of 1670 as the first line that has to be broken before I believe the market direction up has ended.
For MACD Histogram I am using the Fast Points set at 13, Slow Points at 26 and Smoothing at 9. MACD (Moving Averages Convergence / Divergence) issued a weak sell signal on July 31 which was not followed by a confirmation of that sell signal. Today MACD turned negative again but this time the sell signal was negative 1.05 which is enough to indicate that the market direction is turning to down. This tells investors to hedge their bets that the trend could be changing to down.
The Ultimate Oscillator settings are Period 1 is 5, Period 2 is 10, Period 3 is 15, Factor 1 is 4, Factor 2 is 2 and Factor 3 is 1. These are not the default settings but are the settings I use with the S&P 500 chart set for 1 to 3 months.
The Ultimate Oscillator is still positive and surprisingly is turning back up, another indication that the selling may be running its course.
Rate Of Change is set for a 21 period. The rate of change is positive but it is dropping today which shows that investors are staying cautious.
For the Slow Stochastic I use the K period of 14 and D period of 3. The Slow Stochastic is signaling that the market direction is definitely lower.
For the Fast Stochastic I use the K period of 20 and D period of 5. These are not default settings but settings I set for the 1 to 3 month S&P 500 chart when it is set for daily. The Fast Stochastic is indicating that the market direction is down again for tomorrow.
Market Direction Outlook And Strategy for Aug 8 2013
This marks another down day for the market direction but it should be remembered that this downturn is a result of Fed unofficial comments and investor concern that quantitative easing will slow by next month. Any indication to the contrary could send this market direction back up. There is an underlying strength within the market which means that at this point a lot of investors are looking at the present weakness as an opportunity to realign and to add to positions.
I am continuing to work my positions and as explained, the support line at 1670 is my signal tochange my outlook. Meanwhile the market timing technical indicators are mixed with three now negative and three positive. For tomorrow then I would expect much of the same except the close of the market today could be pointing to a bounce back tomorrow. Therefore I am expecting more up than down for Thursday.
Market Direction Internal Links
Profiting From Understanding Market Direction (Articles Index)
Understanding Short-Term Signals
Market Direction Portfolio Trades (Members)
Market Direction External Links
Market Direction IWM ETF Russell 2000 Fund Info
Market Direction SPY ETF 500 Fund Info

