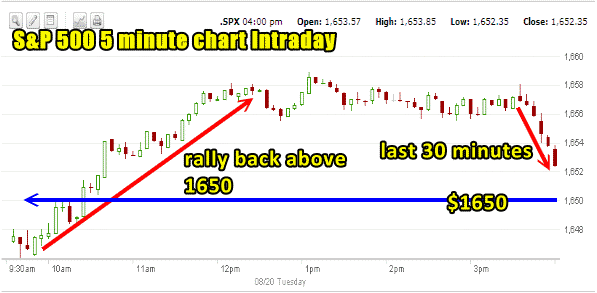
The Market direction outlook for Tuesday was for a bounce back attempt but my personal observation was that at the close of the day, the market direction would again be lower. Instead the bounce worked for the NASDAQ and the S&P 500 but not for the Dow. The 5 minute intraday chart below shows the action for August 20 2013. The morning saw the market direction rally back above the important 1650 valuation which is the second level of support for the most recent rally. Once above 1650 the market direction couldn’t push a lot higher but instead spent most of the time trending sideways.
The last 30 minutes without any clear indication that the market direction could move higher, investors stepped in and sold positions pushing the market back down.

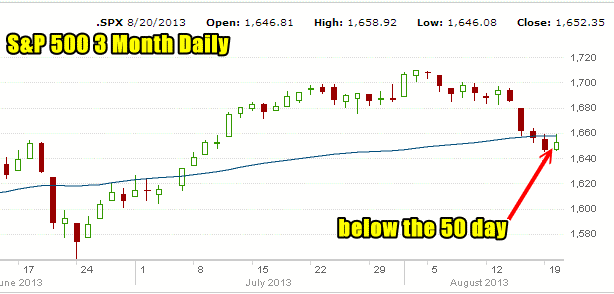
Market Direction Close Below 50 Day SMA
The market direction today however still was unable to hold above the 50 day simple moving average (SMA). For the second day the market direction closed below the 50 day simple moving average (SMA). The market direction must regain the 50 day simple moving average (SMA) quickly over the next day or two, otherwise it will move lower to seek out stronger support.

NASDAQ Market Direction Is Important
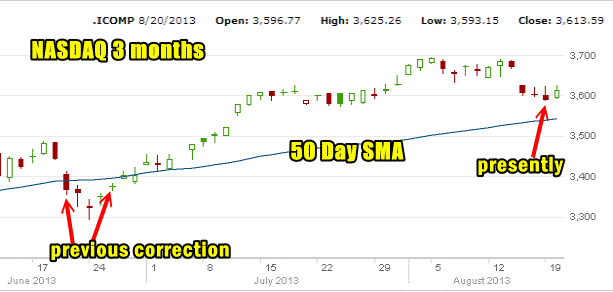
But while the S&P 500 is below the 50 day SMA and the Dow is flirting with 15000 again, the NASDAQ index is not below the 50 day moving average. This is significant since the NASDAQ led the market recovery from 2009 and only just recently saw the lead taken over for a short while by the Dow. Now the NASDAQ is back leading the market direction. While down almost 100 points from its most recent high, the NASDAQ was the first index to point the way back up from the June market correction. Indeed, it was the NASDAQ which I had been watching back in June and realized that the correction was purely a result of the Fed comments from Bernanke and not much else. At present then the NASDAQ is advising that this may end up being a shallow correction. This means that any indication that the market direction correction will end could send stocks soaring higher which will catch a lot of bears “short”, so it is something to be aware of at this point.
The Fed Again
With a technical bounce back on Tuesday then, the markets are sitting ready for the Fed comments. There is a lot of hope that the Fed will finally indicate clearly their plans for scaling back Quantitative Easing. Personally I don’t think there will be much more clarity than before so the market direction go swing either way.
Market Direction Closing For Aug 20 2013
The S&P 500 closed at 1,652.35 up 6.29. The Dow closed at 15,0002.99 down 7.75 after breaking below 15000 intraday. The NASDAQ closed at 3,613.59 up 24.50.
Market Direction Technical Indicators At The Close of Aug 20 2013
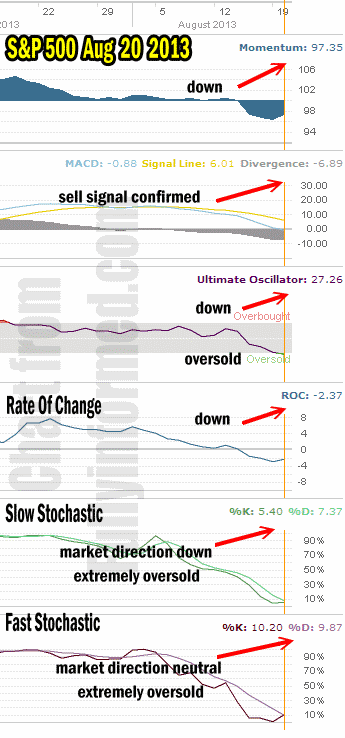
Let’s review the market direction technical indicators at the close of Aug 20 2013 on the S&P 500 and view the market direction outlook for Aug 21 2013. All the technical indicators are still negative and a number remain extremely oversold.

For Momentum I am using the 10 period. Momentum is strongly negative still but turned up slight today.
For MACD Histogram I am using the Fast Points set at 13, Slow Points at 26 and Smoothing at 9. MACD (Moving Averages Convergence / Divergence) issued a weak sell signal on July 31 which was confirmed August 7. Now MACD is pushing even deeper into negative territory.
The Ultimate Oscillator settings are Period 1 is 5, Period 2 is 10, Period 3 is 15, Factor 1 is 4, Factor 2 is 2 and Factor 3 is 1. These are not the default settings but are the settings I use with the S&P 500 chart set for 1 to 3 months.
The Ultimate Oscillator is strongly negative and has reached extremely oversold levels.
Rate Of Change is set for a 21 period. The rate of change is negative but it too turned up slightly today.
For the Slow Stochastic I use the K period of 14 and D period of 3. The Slow Stochastic is signaling that the market direction is lower. It is extremely oversold which could mean a further bounce back is possible.
For the Fast Stochastic I use the K period of 20 and D period of 5. These are not default settings but settings I set for the 1 to 3 month S&P 500 chart when it is set for daily. The Fast Stochastic is indicating that the market direction is turning possibly back to up. The readings are so close that it would appear they are more neutral than up or down. The Fast Stochastic is extremely oversold and due for another bounce as well.
Market Direction Outlook And Strategy for Aug 21 2013
The market direction trend remains lower at present but with the condition of the market remaining so heavily oversold, any news from the Fed that is perceived as “good news” could see the market rally strongly back even if only for a day or two.
There is a lot of pessimism among analysts about the markets moving higher from here, but the put call ratio does not show that investors are overly concerned at this point in the correction. The analysts who are talking about how the “bears are now in charge”, I think are very premature in their outlook. The NASDAQ index on its own is pointing to this being a shallow correction. While many investors are sitting on the sidelines right now, most have not taken themselves out of the market place. This points to a big rally back on any news perceived as good. It’s important to be aware of this and use tight stops on any positions that rely on the market direction moving lower to remain profitable.
For tomorrow I have a few stocks I am watching but aside from those I too am waiting to hear what the Fed has to say before deciding on committing more capital. But I am not very concerned about the present correction. I have a lot of capital tied to my naked put positions and unless I see more solid indicators that point to this correction becoming worse, I will keep looking for Put Selling trade opportunities and take them when they appear.
Market Direction Internal Links
Profiting From Understanding Market Direction (Articles Index)
Understanding Short-Term Signals
Market Direction Portfolio Trades (Members)
Market Direction External Links
Market Direction IWM ETF Russell 2000 Fund Info
Market Direction SPY ETF 500 Fund Info

