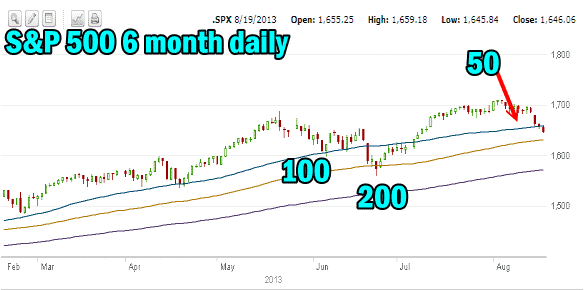
The Market direction outlook for Monday was for the market to attempt to push higher and then sell-off. The S&P 500 did just that as it tried to climb back in the morning but by 11:00 AM the selling pressure was too high and the market steadily fell until by the end of the day it had closed on the lows for the day. The 6 month chart below shows the current market correction. The movement lower has seen 4 days of steady deterioration. The 50 period simple moving average (SMA) was broken through today and the S&P 500 closed below it. This is significant as this places the S&P 500 below the market high back before Fed Chairman Bernanke spooked the markets with his talk of an early exit from Quantitative Easing.
With the S&P 500 now at the 50 day simple moving average (SMA) we could see an attempt to hold it but personally I think the market looks ready to fall to the 100 day exponential moving average (EMA) as its next goal.

At this point in the correction any rally back should be an excuse to take additional profits but I doubt the market direction down has run its course. There is more downside to be expected ahead.
Market Direction Closing For Aug 19 2013
The S&P 500 closed at 1,646.06 down 9.77. The Dow closed at 15,010.74 down 70.73 and ready to break below 15,000 once again. The NASDAQ closed at 3,589.09 down 13.69.
Market Direction Technical Indicators At The Close of Aug 19 2013
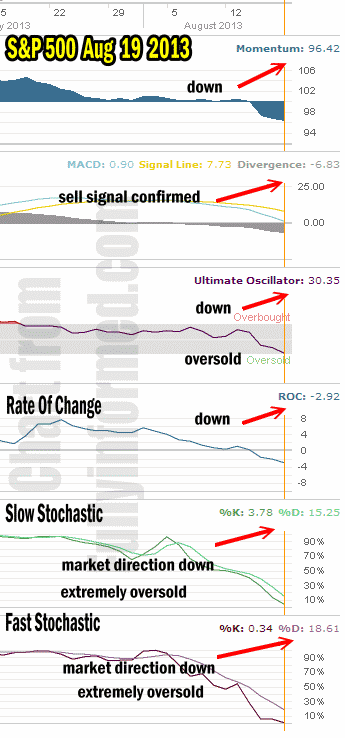
Let’s review the market direction technical indicators at the close of Aug 19 2013 on the S&P 500 and view the market direction outlook for Aug 20 2013. All the technical indicators are now negative and a number are extremely oversold.

For Momentum I am using the 10 period. Momentum is strongly negative.
For MACD Histogram I am using the Fast Points set at 13, Slow Points at 26 and Smoothing at 9. MACD (Moving Averages Convergence / Divergence) issued a weak sell signal on July 31 which was confirmed August 7. Now MACD is pushing even deeper into negative territory.
The Ultimate Oscillator settings are Period 1 is 5, Period 2 is 10, Period 3 is 15, Factor 1 is 4, Factor 2 is 2 and Factor 3 is 1. These are not the default settings but are the settings I use with the S&P 500 chart set for 1 to 3 months.
The Ultimate Oscillator is strongly negative and has reached extremely oversold levels.
Rate Of Change is set for a 21 period. The rate of change is negative and points to more downside ahead.
For the Slow Stochastic I use the K period of 14 and D period of 3. The Slow Stochastic is signaling that the market direction is lower. It is extremely oversold which could mean a bounce is imminent.
For the Fast Stochastic I use the K period of 20 and D period of 5. These are not default settings but settings I set for the 1 to 3 month S&P 500 chart when it is set for daily. The Fast Stochastic is indicating that the market direction is down again for Tuesday but the reading is extremely oversold which could be pointing to a bounce back.
Market Direction Outlook And Strategy for Aug 20 2013
The market direction trend is definitely lower. There are no technical indicators that remain positive at this point. With the mood decidedly negative among investors, the market direction down is extremely oversold. We could get a bounce here but it would be technical in nature on Tuesday unless the Fed intervenes. Wednesday the Fed reports so we could see a move higher at that point but for now the market direction looks ready to move lower and challenge the 100 day exponential moving average (EMA). I sold a number of puts today but I will be scaling back the number of contracts in case the market direction decides to challenge the 100 and then 200 day exponential moving average (EMA). That would lead too better Put Selling opportunities.
For Tuesday then, the market direction down is heavily oversold and once again we could see an attempt to stage a rally back up. I doubt it will succeed and my personal outlook is that we will be lower at the close tomorrow, even if just slightly.
Market Direction Internal Links
Profiting From Understanding Market Direction (Articles Index)
Understanding Short-Term Signals
Market Direction Portfolio Trades (Members)
Market Direction External Links
Market Direction IWM ETF Russell 2000 Fund Info
Market Direction SPY ETF 500 Fund Info
