My Market direction outlook for Wednesday was for the market direction to drift sideways and then back up. Instead the market opened higher but then sold off. For the first time in a long time, the selling was not met with the dip buyers. This could mark a change to investor sentiment which the rate of change indicator may tell us. More on that further in this article.
The Dow suffered a triple digit loss and the S&P 500 closed down half a percent. Meanwhile the European Union claimed their longest recession in Euro history has ended. But in the US, revenue numbers from the S&P 500 are showing an overall gain of just 2.2% so far in the latest quarter. Macy’s store which is a bellwether of retail sales reported a disappointing earnings for the second quarter and a decline in revenue. They cut their forecast for the year. Microsoft Stock had another downgrade but Apple Stock pushed to the $500 level before closing just off the highs.
Market Direction Action For August 14 2013
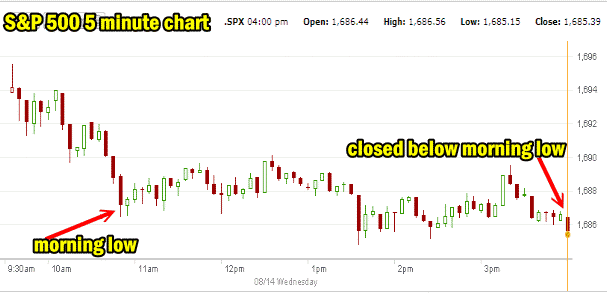
The 5 minute intraday chart below shows two areas of concern that developed on Wednesday. The morning set an intraday low but the close was below the morning low. This has not happened in more than two weeks.
10 Day Market Direction Chart
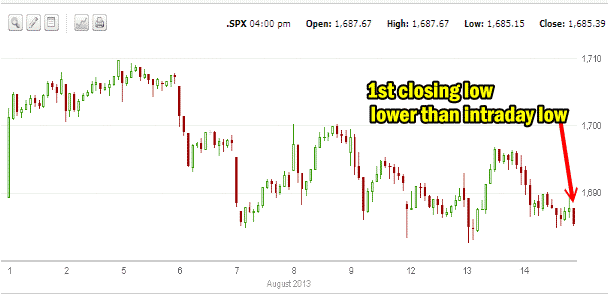
Despite all the sideways action, the 10 day 5 minute intraday chart below shows that only on Wednesday did the S&P close at a lower low than the morning intraday low. This needs to be watched and could be a turning point in the overall direction. If market direction bounces back for a day, it could be suspect and should be carefully watched. Today’s closing low point while certainly not the lowest point of the past 10 days is important simply because it was a low beyond the early morning low.
Market Direction Closing For Aug 14 2013
The S&P 500 closed at 1,685.39 down 8.77. The Dow closed at 15,337.66 down 113.35. The NASDAQ closed at 3,669.27 down 15.17.
Market Direction Technical Indicators At The Close of Aug 14 2013
Let’s review the market direction technical indicators at the close of Aug 14 2013 on the S&P 500 and view the market direction outlook for Aug 15 2013.
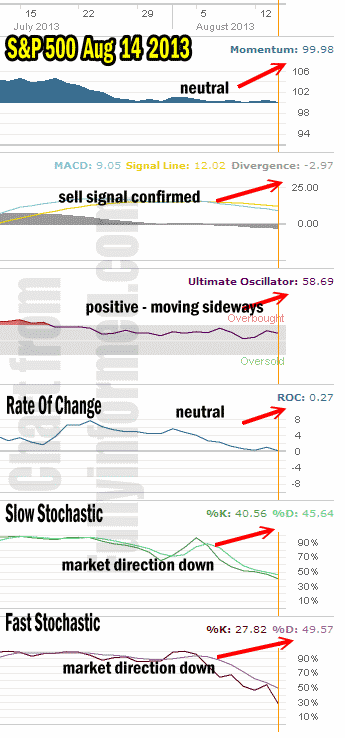
For Momentum I am using the 10 period. Momentum remained neutral again today despite the market being under selling pressure all day.
For MACD Histogram I am using the Fast Points set at 13, Slow Points at 26 and Smoothing at 9. MACD (Moving Averages Convergence / Divergence) issued a weak sell signal on July 31 which was confirmed August 7 and today that sell signal is back climbing signaling lower prices may be ahead.
The Ultimate Oscillator settings are Period 1 is 5, Period 2 is 10, Period 3 is 15, Factor 1 is 4, Factor 2 is 2 and Factor 3 is 1. These are not the default settings but are the settings I use with the S&P 500 chart set for 1 to 3 months.
The Ultimate Oscillator is still positive but is sideways.
Rate Of Change is set for a 21 period. The rate of change is neutral now with a reading of just 0.27 and indicates that the investor interest in buying this dip in stocks was not present for most of the trading day.
For the Slow Stochastic I use the K period of 14 and D period of 3. The Slow Stochastic is signaling that the market direction is lower.
For the Fast Stochastic I use the K period of 20 and D period of 5. These are not default settings but settings I set for the 1 to 3 month S&P 500 chart when it is set for daily. The Fast Stochastic is indicating that the market direction is down again for Thursday.
Market Direction Outlook And Strategy for Aug 15 2013
My market direction outlook for Wednesday was wrong and the signals from the technical indicators should have been followed and not second-guessed by me. The indicators yesterday still showed the market direction would be lower but I felt there were enough indications that the signals would turn up that I jumped in with my own forecast rather than presenting the outlook from the technical indicators.
Today the technical indicators are showing renewed weakness and a move lower for tomorrow.
Therefore if there is a bounce back tomorrow it will be suspect and should be watched carefully.
Market Direction Intraday Trend Break
The most important event technically for market direction was the close today which was below the morning low, a first in some time. This breaks the trend where the morning lows have been bought by investors and the market recovered from each morning low. This could be a signal that the trend up is in jeopardy. It needs to be watched closely.
The market direction could be reaching the point of fatigue and may need to pull back. Revenue has not met even the most reduced of analysts’ estimates. Revenue is the milestone that must be watched as it is a number analysts can hardly manipulate. Either a company improves its revenue or it does not. It is that simple. Earnings on the other hand are easily manipulated and while important, earnings are not as important as revenue.
I remain unconcerned about the market direction until the S&P 500 reaches 1670. If that occurs I will be buying Spy Put Options. That said there are enough warnings to advise me that when trading I should stay to the down side with my Trading For Pennies Strategy trades and watch for good Put Selling opportunities. Today I did a trade of Fortis stock (FTS) but the stock closed below my purchase price. I also sold Apple Stock (AAPL) puts within my Biweekly Put Selling Strategy which is working well for this year. Tomorrow I will be watching stocks like Coca Cola (KO) which look poised to possibly move lower for Put Selling profits.
Market Direction Internal Links
Profiting From Understanding Market Direction (Articles Index)
Understanding Short-Term Signals
Market Direction Portfolio Trades (Members)
Market Direction External Links
Market Direction IWM ETF Russell 2000 Fund Info
Market Direction SPY ETF 500 Fund Info


