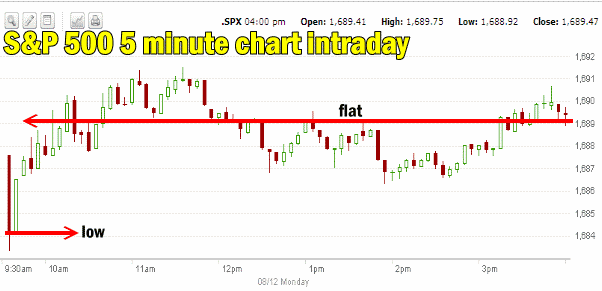
The Market direction outlook for today was for weakness in the markets. The NASDAQ managed to end with a slight rise but equally impressive were the Dow and S&P 500 both of which started the day lower, recovered and then spent the rest of the day flat ending with slight losses.
The S&P 500 5 minute daily chart below shows the action from today. The market opened with a drop and then recovered quickly. The remainder of the day the market direction was primarily flat. Investors remain fairly convinced that the market direction higher will resume shortly and they are continuing to buy stocks on dips in anticipation that the market will push higher shortly.
As we are now half way through August, they could in fact be correct. August may turn out to be a poor month but as long as stocks fail to sell-off, September may see stocks try to move higher. Personally I have doubts that will happen but I am happy to keep selling puts while waiting for the market direction to sort itself out and give clearer signals.
Market Direction Closing For Aug 12 2013
The S&P 500 closed at 1,689.47 down 1.95. The Dow closed at 15,419.68 down 5.83. The NASDAQ closed at 3,669.95 up 9.84.
Market Direction Technical Indicators At The Close of Aug 12 2013
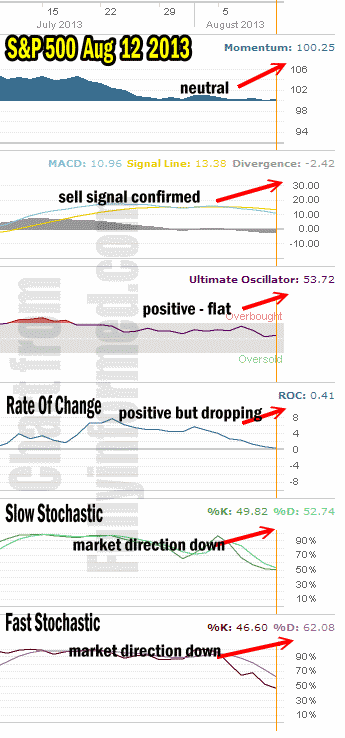
Let’s review the market direction technical indicators at the close of Aug 12 2013 on the S&P 500 and view the market direction outlook for Aug 13 2013.
For Momentum I am using the 10 period. Momentum remained neutral again today which is to be expected when looking at the overall market direction which is flat.
For MACD Histogram I am using the Fast Points set at 13, Slow Points at 26 and Smoothing at 9. MACD (Moving Averages Convergence / Divergence) issued a weak sell signal on July 31 which was confirmed August 7 and today that sell signal is continuing to climb.
The Ultimate Oscillator settings are Period 1 is 5, Period 2 is 10, Period 3 is 15, Factor 1 is 4, Factor 2 is 2 and Factor 3 is 1. These are not the default settings but are the settings I use with the S&P 500 chart set for 1 to 3 months.
The Ultimate Oscillator is still positive but has fallen dramatically over the past several days and is flat today.
Rate Of Change is set for a 21 period. The rate of change is positive but has taken a large drop over the past several days as well and is on the verge of turning negative.
For the Slow Stochastic I use the K period of 14 and D period of 3. The Slow Stochastic is signaling that the market direction is definitely lower.
For the Fast Stochastic I use the K period of 20 and D period of 5. These are not default settings but settings I set for the 1 to 3 month S&P 500 chart when it is set for daily. The Fast Stochastic is indicating that the market direction is down again for Monday.
Market Direction Outlook And Strategy for Aug 13 2013
Nothing really new to say about the market direction. The S&P remains stuck in a sideways pattern with most investors holding for stocks to push back higher. The market direction technical indicators do not show much of a further deterioration in the market direction but they are certainly not signaling that the market direction will turn back up tomorrow. Instead they remain pointing to more negative movements for the market direction.
For tomorrow then I am expecting much the same as today and I am continuing looking for Put Selling opportunities such as may occur in YUM Stock, per my article this evening. I remain unconcerned on market direction unless the S&P breaks 1670 at which point I will buy Spy Put Options. Until then the market is still in a holding pattern.
Market Direction Internal Links
Profiting From Understanding Market Direction (Articles Index)
Understanding Short-Term Signals
Market Direction Portfolio Trades (Members)
Market Direction External Links
Market Direction IWM ETF Russell 2000 Fund Info
Market Direction SPY ETF 500 Fund Info


