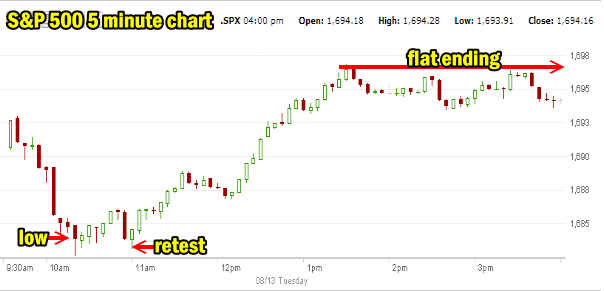
The Market direction outlook for today was for weakness and a flat market. Overseas the Japanese market moved 2.5% in large part due to comments regarding reducing Japanese Corporate taxes. Anything of this nature will get investors enthused and the S&P market direction opened higher at the start. From there the market sold off as you can see in the chart below. This has become the pattern with the sideways action of the market direction. Sell-offs in the morning and then a push back once investors are convinced the morning bottom is in. You can see in the chart that there was a re-test of the first morning low and then the market direction pushed back up and then stayed flat into the close.
The push back up was helped in large part by Fed Comments from Atlanta Fed Lockhart who blamed the “uneven performance” of the economy for the Fed being unable to provide “certainty” to the markets. His comments helped to push the market direction back up and then flat for the remainder of the day.
Unconcerned On Market Direction
At the present time I am still unconcerned on the market direction and continuing to sell puts whenever the opportunity arises. YUM Stock was my target this morning and I sold puts near the open. Many analysts are concerned that the stock market is unable to maintain any kind of clear direction but at this point I disagree. I think the direction is obvious. There remains very little selling pressure of any strength but while most investors don’t want to sell they also do not want to add too many additional shares until they see the market direction move higher. Therefore the direction remains “contained”. I have seen this type of market many times over the past decades so perhaps a lot of analysts have just not been investing long enough.
US Dollar and Treasuries
The US Dollar continues to pull back slightly which is also lending some support to stocks but not to many commodities including gold. Treasury Bonds and Notes rose today. The yield on the 10 year note climbed to its highest level in 2 years as news of European industrial production rose, particularly in Germany (again). Overall though despite what investors believe, the general figure of impact of European industry on S&P 500 companies on average is just 10%. But the perception of improvement is valuable as well to keep investors in stocks.
Rising Interest Rates
Rising interest rates while helpful for insurance companies, banks and utilities will suppress housing stocks and we saw some movement on that front today.
Apple Stock
Investor and speculator Carl Icahn revealed a stake of around 5% in Apple Stock and announced he believes the stock will recover to $600. Once again Icahn has helped to push another stock up as Apple Shares move up $22.21 to close at $489.57. I will update my Apple Stock biweekly Put Selling strategy trades shortly but suffice to say I am well on my way to earning better than 30% for this year.
Market Direction Closing For Aug 13 2013
The S&P 500 closed at 1,694.16 up 4.69. The Dow closed at 15,451.01 up 31.33. The NASDAQ closed at 3,684.44 up 14.49.
Market Direction Technical Indicators At The Close of Aug 13 2013
Let’s review the market direction technical indicators at the close of Aug 13 2013 on the S&P 500 and view the market direction outlook for Aug 14 2013.
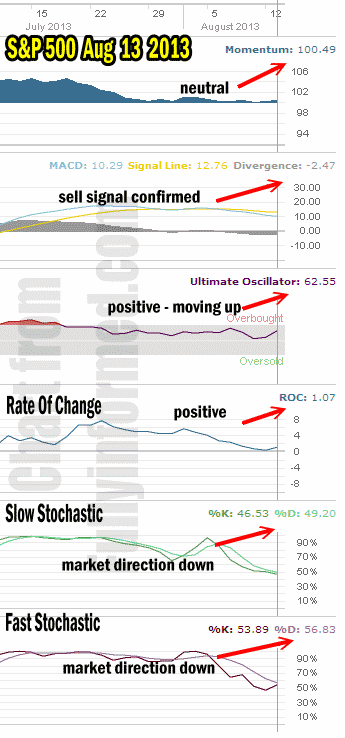
For Momentum I am using the 10 period. Momentum remained neutral again today which is to be expected when looking at the overall market direction which is flat.
For MACD Histogram I am using the Fast Points set at 13, Slow Points at 26 and Smoothing at 9. MACD (Moving Averages Convergence / Divergence) issued a weak sell signal on July 31 which was confirmed August 7 and today that sell signal has climbed over the past several days but today moved flat.
The Ultimate Oscillator settings are Period 1 is 5, Period 2 is 10, Period 3 is 15, Factor 1 is 4, Factor 2 is 2 and Factor 3 is 1. These are not the default settings but are the settings I use with the S&P 500 chart set for 1 to 3 months.
The Ultimate Oscillator is still positive and is moving back up.
Rate Of Change is set for a 21 period. The rate of change is positive although it has collapsed greatly over the past several days of flat movement. Today it is turning back up.
For the Slow Stochastic I use the K period of 14 and D period of 3. The Slow Stochastic is signaling that the market direction is lower but it is beginning to slow its descent calls.
For the Fast Stochastic I use the K period of 20 and D period of 5. These are not default settings but settings I set for the 1 to 3 month S&P 500 chart when it is set for daily. The Fast Stochastic is indicating that the market direction is down again for Wednesday.
Market Direction Outlook And Strategy for Aug 14 2013
Once more there is not a lot of new data to sift through. The Slow Stochastic and Fast Stochastic are both beginning to point to a chance the trend down may shift back to up. Nothing points to big moves either up or down. I still see nothing that concerns me. I am continuing to stay invested and looking for opportunities daily. Despite MACD continuing to show weakness I do believe it is turning more flat than lower. Meanwhile momentum refuses to collapse negative but hangs in the neutral zone. When I add in the two stochastics indicators which are beginning to turn back up with their readings we could see a higher close again tomorrow.
Market Direction Internal Links
Profiting From Understanding Market Direction (Articles Index)
Understanding Short-Term Signals
Market Direction Portfolio Trades (Members)
Market Direction External Links
Market Direction IWM ETF Russell 2000 Fund Info
Market Direction SPY ETF 500 Fund Info


