Market Direction today followed part of yesterday’s market direction technical analysis but then turned back up and pushed to close with a gain of 6.29 points recovering some of yesterday’s drop. Technically it looked like a bounce back from an oversold condition from Wednesday’s selling, but I believe there was some serious buying today. This is after all a bull market and sell-offs and corrections are nothing more than opportunities to get into a trade at lower prices. It is interesting though how when markets are climbing investors are clamouring to get in and then when they pull back, even if for a day they worry that it’s not the right time. This is just another reason I believe selling put options is a superior method of investing. Instead of worrying about when to invest, I look for the valuation I would comfortably own a stock and then sell puts to work my way into that price point.
Market Direction Action For Today
The Weekly Initial Unemployment Insurance Claims released today did not help the market direction move higher. Those who follow the Weekly Initial Unemployment Insurance Claims on my website know that any week where claims climb above 375,000 the market has trouble rising. The numbers today were poor with claims rising 28,000 to 385,000 which marks a 4 month high. Tomorrow we get the March unemployment numbers.
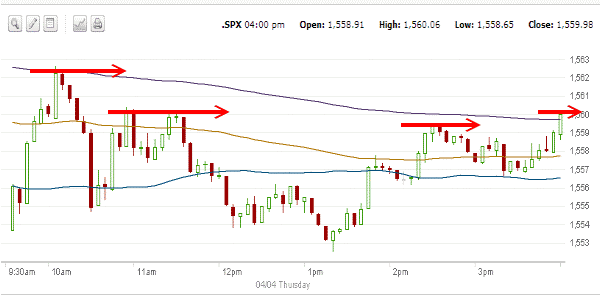
Below is today’s market direction action on the S&P 500 in a 5 minute time chart. The market made a recovery attempt in the morning and then sold off turning negative shortly after 1:00 PM. Buyers step in at this point and pushed the S&P 500 back up but failed to recover the early morning high. Overall the day looked like a technical rebound and not much more.

IWM ETF Russell 2000 and Market Direction
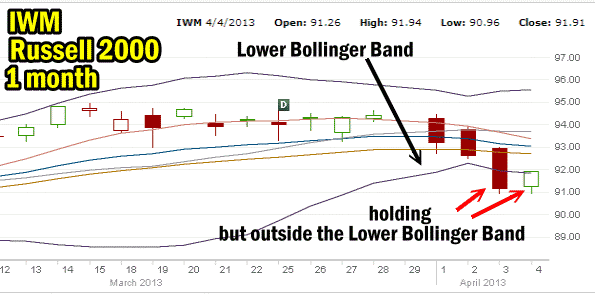
I have previously mentioned the Russell 2000 ETF, IWM several times in my write-ups on market direction. The Russell 2000 yesterday broke through the Lower Bollinger Band and then today moved sideways, closing right at the Lower Bollinger Band. Overall though the IWM ETF is clinging to outside the Lower Bollinger Band which is almost always a signal of more selling ahead. Despite this, IWM is worth watching as it may hold the clue to the next move in market direction. If IWM pulls to inside the Lower Bollinger Band we may see the market begin to recover. IWM ETF has fallen further than any of the indices.

Market Direction Closing For Apr 4 2013
The S&P 500 closed at 1559.98 up 6.29 points and the Dow closed at 134,606.11, up 55.76 points. The NASDAQ closed at 3224.98 up 6.38 points.
Market Direction Technical Indicators At The Close of Apr 04 2013
Let’s take a moment now and review the market direction technical indicators at today’s close on the S&P 500 and view the next trading day’s outlook.

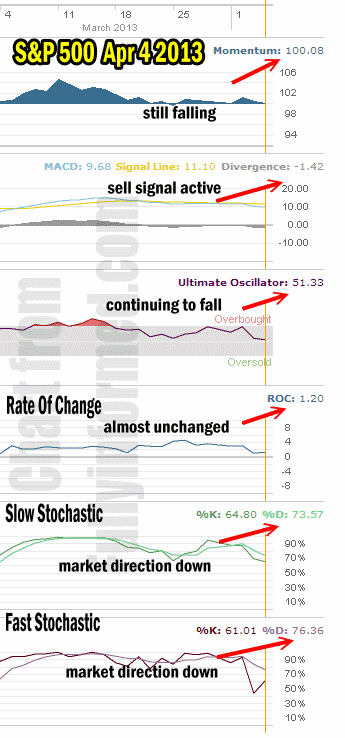
For Momentum I am using the 10 period. Momentum is still falling and is on the verge of turning negative. Today’s action did nothing to turn momentum higher.
For MACD Histogram I am using the Fast Points set at 13, Slow Points at 26 and Smoothing at 9. MACD (Moving Averages Convergence / Divergence) is still moving lower and increasing the strength of the sell signal.
The Ultimate Oscillator settings are Period 1 is 5, Period 2 is 10, Period 3 is 15, Factor 1 is 4, Factor 2 is 2 and Factor 3 is 1. These are not the default settings but are the settings I use with the S&P 500 chart set for 1 to 3 months.
The Ultimate Oscillator is still falling lower.
Rate Of Change is set for a 21 period. Rate Of Change is still positive but is almost unchanged from Thursday..
For the Slow Stochastic I use the K period of 14 and D period of 3. The Slow Stochastic is still signaling market direction down.
For the Fast Stochastic I use the K period of 20 and D period of 5. These are not default settings but settings I set for the 1 to 3 month S&P 500 chart when it is set for daily. The Fast Stochastic is also signaling that the market direction is down.
Market Direction Outlook And Strategy for Apr 05 2013
Market Direction today, I believe, followed a typical pattern after a big down day yesterday. Indeed this has been the pattern throughout much of the last two weeks. Tomorrow I would expect the pattern of the market direction trying to move higher but then breaking lower to re-emerge. Today’s rally did not convince any of the market direction technical indicators that the outlook has changed any at all. In fact, most have turned still lower despite the market direction pushing back and trying to recapture much of what has been lost.
My outlook then based on the market direction technical indicators consensus is that the market direction tomorrow will move higher and then sell lower. While I am not expecting any large decline, the unemployment numbers could have a dramatic if short, impact on the market direction but overall it looks like the market direction wants to move lower before trying to move back up.
Internal Market Direction Links
Profiting From Understanding Market Direction (Articles Index)
Understanding Short-Term Signals
Market Direction External Links
