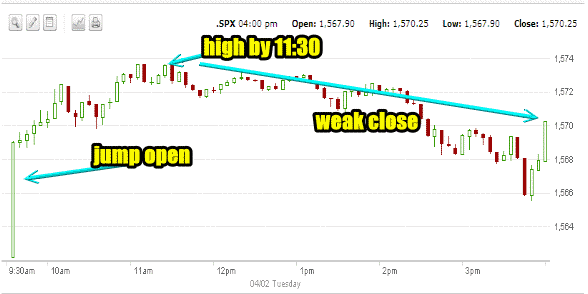
Market Direction technical indicators from Monday, called for weakness in the market but the push higher to continue. The S&P 500 market direction followed the technical indicators once again today with a big open jump, morning high and then the rest of the day the market selling off and closing weak. Let’s take a closer look at today’s market direction action.
Market Direction Action For Today
The S&P 500 by 11:30 was challenging the Oct 11 intraday high of 1576.09 and at the close managed to set a new all time record close of 1570.25 beating the Oct 9 record close of 1565.15. The market direction though was as expected, bullish but still exhibiting weakness. You can see in the intraday 5 minute S&P 500 chart below the big jump open and then the climb by 11:30 followed by a pull back which in the final few minutes still closed at an all time high.

Part of the reason for the moves was a 3 % rise in US Factory Orders in February which narrowly beat the expected 2.9% gain. This is also the biggest jump in 5 months which investors pointed to as signs of continued strength in the US economy.
As well the modest decline of Euro bond yields buoyed investors. All of this also affected the US dollar which rose while the price of Gold fell $24.60 the biggest decline in over a month.
Market Direction Closings
The S&P 500 closed at 1570.25, up 8.08 points and the Dow closed at 14,662.01, up 89.16 points. The NASDAQ closed at 3254.86 up 15.69 points.
Market Direction Technical Indicators At The Close of Apr 02 2013
Let’s take a moment now and review the market direction technical indicators at today’s close on the S&P 500 and view the next trading day’s outlook.

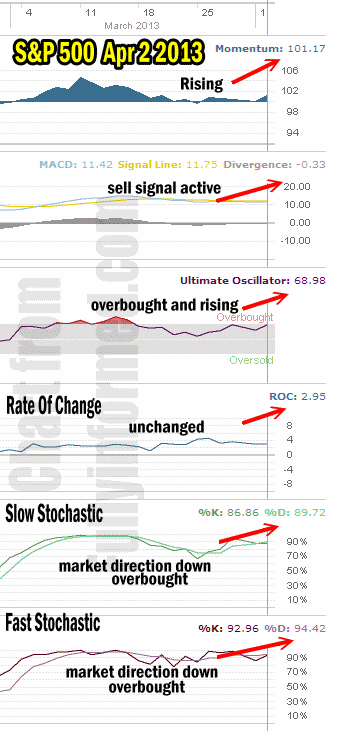
For Momentum I am using the 10 period. Momentum is back climbing, having failed to turn negative on Monday.
For MACD Histogram I am using the Fast Points set at 13, Slow Points at 26 and Smoothing at 9. MACD (Moving Averages Convergence / Divergence) is still signaling sell.
The Ultimate Oscillator settings are Period 1 is 5, Period 2 is 10, Period 3 is 15, Factor 1 is 4, Factor 2 is 2 and Factor 3 is 1. These are not the default settings but are the settings I use with the S&P 500 chart set for 1 to 3 months.
The Ultimate Oscillator is still positive and is back climbing into overbought territory.
Rate Of Change is set for a 21 period. Rate Of Change is still positive but was not impressed by the rally higher and remains virtually unchanged.
For the Slow Stochastic I use the K period of 14 and D period of 3. The Slow Stochastic is overbought to and is signaling that market direction will be lower by week’s end.
For the Fast Stochastic I use the K period of 20 and D period of 5. These are not default settings but settings I set for the 1 to 3 month S&P 500 chart when it is set for daily. The Fast Stochastic is also overbought and in indicating that market direction is down for tomorrow.
Market Direction Outlook And Strategy for Apr 03 2013
For the market direction to be convincing it has to break through this see saw environment and move convincingly higher. This is something the market has been unable to do. Market direction today was typical as it open to a bounce with the factory orders and European news and then climbed into the morning and then spent the rest of the day selling lower.
While this is to be expected due to the S&P 500 breaching the all-time highs, this see saw type action is indicative of investors remaining convinced that the market will move higher, but keeping one foot at the door “just in case”. This makes the market direction move higher suspect and as you can see from the market direction technical indicators, they too continue to remain mixed.
On one hand we have momentum creeping higher, the Ultimate Oscillator back in overbought and trying to push higher and then we have the rate of change virtually unchanged. Add in the Fast Stochastic and Slow Stochastic both of which point to lower market direction which supports MACD which continues to stubbornly advise that the market direction is still under pressure. You can see then the quandary that the market direction technical indicators are in which is the same stance of most investors.
No investors want to give up on the market direction moving higher but they remain worried that they could get caught on a downturn. But if you look at many stocks you can see that the market is already going through a cyclical change without actually having to fall. Previous metals stock are at very low valuations and today steel stocks took a hit. As well technology has been soft but health care and most financials are doing better. Sectors are already rotating even without the market direction shifting lower.
This is the kind of market direction I like to stay invested with but only through Put Selling at strikes I would own the stocks I sell puts against. This is the great thing about Put Selling. Since I have the conviction that even if the market direction does turn lower it will only be at 2 % to 5% certainly at the outset. Therefore selling puts and continue to bring in income makes a lot of sense. Basically I do not have to be right on market direction, but I do have to remain cautious which is exactly what Put Selling is very good for.
Market Direction for Wednesday then is for continued weakness but again market direction will try to push higher and weighing the market direction technical indicators, the consensus is that the bias is more neutral than down or up. So sideways with a bias to the upside looks good for tomorrow.
Internal Market Direction Links
Profiting From Understanding Market Direction (Articles Index)
Understanding Short-Term Signals
Market Direction Candlestick Daily View (Members only)
Market Direction Portfolio Ongoing Trades (Members only)
Market Direction External Links
