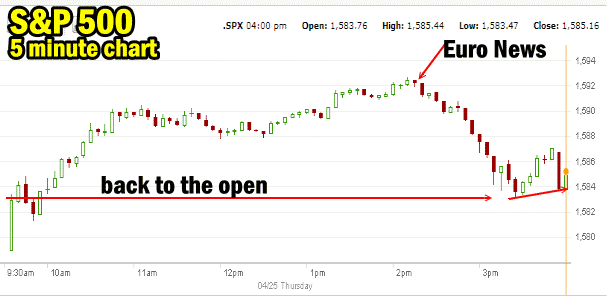
Market Direction today was moving better for much of the day and then around 2:15 PM news came that Germany’s high court may reject Outright Monetary Transactions. Basically what this means for Europe is that the European Central Bank through OMT could prop up smaller troubled Euro Members through additional fundings of varying size and methods. It was not the thought that Germany may reject OMT but the thought that Europe’s mess may rear its ugly head again that sent stocks lower. The S&P fell from 1592.42 down to 1583.23 on the news. The DOW which was at 14768.00 fell to 14683.40. Tuesday the markets faced a fake bomb scare and now Thursday Europe was back on the table. I wonder what’s next.
Market Direction S&P 500 chart
Today’s market direction action is obvious in the chart below. The market opened and immediately pushed higher. A rally then commenced which at about 2:15 caved on the Euro News. This pushed the market direction back to the open. A slight rise into the close was sold at the end of the day. A disappointing day for the markets but still higher in the end.

S&P 500 for Apr 25 2013 - 5 minute Market Direction Chart
Market Direction and IWM ETF Russell 2000
The Russell 2000 sold off somewhat on the same news but then managed a better recovery and closed near the highs for the day and more important, closed above the 50 day simple moving average (SMA) having now recovered both the 100 day exponential moving average (EMA) and 50 day simple moving average (SMA).
Market Direction Closing For Apr 25 2013
The S&P 500 closed at 1,585.16 up 6.37 points. The Dow closed at 14,700.80 up 24.50 points. The NASDAQ closed at 3289.99 up 20.33 points.
Market Direction Technical Indicators At The Close of Apr 25 2013
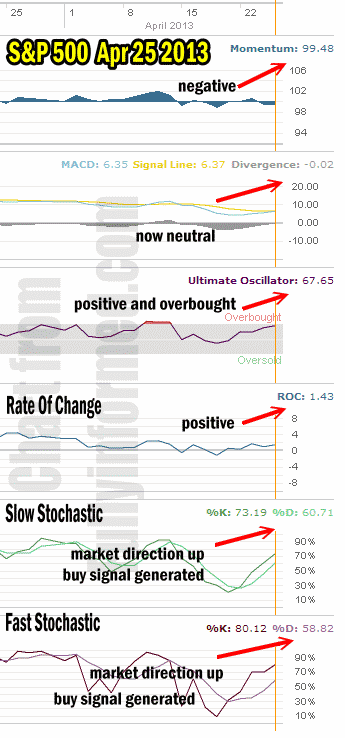
Let’s take a moment now and review the market direction technical indicators at the close of Apr 25 2013 on the S&P 500 and view the market direction outlook for April 26 2013.
 For Momentum I am using the 10 period. Momentum is slightly negative although for most the day it was positive and if the Euro News had not hit the market it would have ended positive.
For MACD Histogram I am using the Fast Points set at 13, Slow Points at 26 and Smoothing at 9. MACD (Moving Averages Convergence / Divergence) issued a sell signal on Monday April 15. Today that sell signal is gone. If tomorrow is higher it will issue a buy signal.
The Ultimate Oscillator settings are Period 1 is 5, Period 2 is 10, Period 3 is 15, Factor 1 is 4, Factor 2 is 2 and Factor 3 is 1. These are not the default settings but are the settings I use with the S&P 500 chart set for 1 to 3 months.
The Ultimate Oscillator is higher again today and now signaling overbought.
Rate Of Change is set for a 21 period. Rate Of Change positive showing there was a good amount of buying during most of the day.
For the Slow Stochastic I use the K period of 14 and D period of 3. The Slow Stochastic has generated a buy signal on April 22 and indicates the market direction is higher.
For the Fast Stochastic I use the K period of 20 and D period of 5. These are not default settings but settings I set for the 1 to 3 month S&P 500 chart when it is set for daily. The Fast Stochastic also issued a buy signal on April 22 and is indicating that tomorrow market direction will continue to climb.
Market Direction Outlook And Strategy for Apr 26 2013
The Euro News event was disappointing but it shows just how nervous investors are, but the slight recovery shows that investors in general are convinced that the market direction is still higher. You must remember that at these levels it is trading going on now. I cannot believe that anyone buying most of the leading stocks are doing it for any long-term gain or to build a core portfolio. That type of buying should have happened back in 2010 or 2011 but certainly not now.
With the market direction so close to the all-time high set earlier this month, the S&P 500 must break that high and then confirm the trend is back up by moving into higher ground. That could be tough for this market. That is the only thing that will convince me that longer-term this market direction move higher can actually occur.
We are nearing the end of April and the end of the best 6 months of the year for stocks. Those six months are Nov 1 through to April 30. With just 3 more trading days left in April I believe the best strategy is staying with small positions and out of the money with puts. For stock traders, taking profits or using stop-losses are the best way to play the next week.
Tomorrow the market direction indicators are pointing to another weak start, then an attempt to move higher but overall there does not seem to be enough conviction to get the market direction up and keep it up. I will not be surprised if we see the S&P 500 push to a new high in one of the next 3 trading sessions but then put in that dreaded double top. But that is just prediction on my part with no evidence to support it except to say that revenue has been disappointing in general this quarter and while earnings often have been met or exceeded, those earnings estimates were repeatedly lowered so it is not too surprising that we are hearing about met earnings estimates.
For tomorrow I will be continuing with the same strategy as before. I am using small positions, taking profits constantly, rolling when needed and keeping larger amounts of cash to the sidelines as we get ready to enter into May. Tomorrow promises to be exactly the same and while the technical indicators show there is still strength to move higher I have to wonder out loud if it is too late now for a resumption of the rally. Therefore while the indicators show up for tomorrow, I believe caution is heavily warranted and I will be taking profits whenever they appear.
Internal Market Direction Links
Profiting From Understanding Market Direction (Articles Index)
Understanding Short-Term Signals
Market Direction Portfolio Trades (Members)
Market Direction External Links
