The Market Direction on Monday had just about everything thrown in. The market was hit with a possible slow down in China, housing builder confidence, huge collapse of gold bullion price, oil price decline and run-up of the US dollar (remember when it was toast?) and finally a terrorist attack at the Boston marathon. For jittery investors it was just too much and once the selling started it was hard to stop. In the afternoon as the Dow slipped by 200 points a rally commenced pulling back almost 50 points before the news of the explosions in Boston shock investor confidence and the selling resumed. But still the selling today at this high a level in all the indexes pales when compared to the last bear market, and days of selling in 2011 and 2010. So is the selling just getting started?
Keeping Market Direction In Perspective
The S&P 500 and the Dow are up over 10% this year before today’s selling. At the start of the year most predictions were for the markets to be higher by 10% for the year! As the markets moved higher more investors kept dumping in fresh capital as the bullishness returned. But it’s important to keep things in perspective. The higher the markets are the larger the declines can be. For example, today’s decline saw the Dow down 1.79%, the S&P 2.3% and the NASDAQ down 2.38%. These are big numbers but recall just how many days this year the market direction was up over 1% in a day. Investor exuberance is often followed by investor fear. Remember that fear drives markets. Investor fear they are missing a big rally and indeed analysts have said repeatedly that “stocks are the place to be”. They have pushed dividend stocks like they are bank certificates. They are not. Yet fear of missing out on a big move in the market dragged a lot of investors in. Now the fear is the other way. Fear of being suckered into a big decline.
Market Direction and A Stock Watch List
The beauty of Put Selling is that as markets climb those of us interested in Put Selling stocks can sell smaller and smaller positions and take the opportunities of dip buying to sell little dips in stocks as the uptrend continues. Through it all we can keep earning gains and buy to close our positions early and free our capital again. Meanwhile we are Put Selling at strikes that are out of the money on stocks and often at prices we feel is fair value. Many of the puts I have sold are at prices I would own the underlying shares I have sold puts at. On top of this there are dozens of strategies we can use to just keep bringing in premium that even assignment of stock is not even definite. Put Selling and indeed just about every option strategy there is offers investors the ability to remain flexible no matter what the market condition.
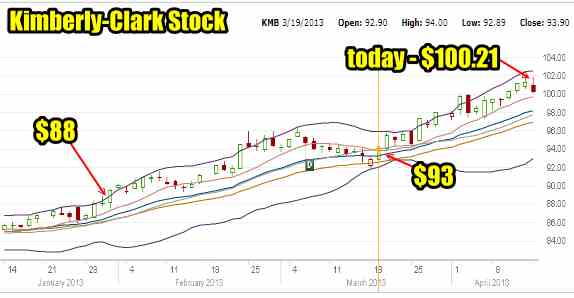
I keep a watch list of stocks and recently I discussed the color code strategy for timing different stock and option positions on stocks. Even with today’s sell-off many of the stocks on my watch list are very overvalued. I see absolutely no reason to bring my cash out to play. This is not a bear market and there are no fire sale prices here. Even ABX Stock which is now down to long-term support at $20, is a good buy, but it is not at fire-sale prices. The strategy then must remain Put Selling around the $20 strike and wait for either a recovery or for when the stock is truly at fire-sale prices. Johnson and Johnson Stock (JNJ) today fell to $81.71, but is it undervalued? Absolutely not. Clorox Stock (CLX) fell to $87.61 again far from being on sale. Kimberly-Clark Stock (KMB) fell to $100.21. On March 19 I sent out a trade alert that I had sold the April 20 $87.50 put strike. When I looked at the chart today for Kimberly-Clark Stock I was surprised by the comments from a CNBC reporter who exclaimed “They’re even selling Kimberly-Clark for goodness sake!”. Well I would hope so. It is way overvalued up 14% since the end of January when it was at $88.00.

A pullback has been in the cards for a while but as stocks kept getting pushed higher, more and more investors jumped in and kept pushing them up. But today’s selling is small and has made just a small dent in many stocks that are overvalued. Indeed on my market direction comments on Sunday I indicated that 30% of ALL stocks had made new 52 week highs by last week. So is the market ahead of itself going into earnings. Absolutely.
Keep your watch list handy and look at your favorite stocks and see what put strike levels are sitting at fair value and you will be surprised at how many are very overvalued. This is why I have repeatedly indicated that I am selling smaller contract sizes. I have very few positions with even 10 naked put contracts. Most are 5 contracts because stocks are expensive despite what analysts keep telling investors. We need stellar earnings this quarter to keep stocks at the present level. Those earnings must come in around 11% higher than last year during the same quarter.
Dividend Yield
The dividend yield of the S&P 500 is now 2.13% which is below the historic average of 3.11%. Dividends have become low and instead of increasing dividends and engaging in share buy backs, companies are not hiring and are hoarding their cash. If businesses do not show confidence this will bleed into other sectors of the economy including consumer confidence.
Price To Earnings
Quality companies are not cheap. If you look at the Shiller P/E ratio which adjusts for inflation the S&P 500 is sitting at 23.47 or about 4 times higher than the average which is about 19.7 times earnings.
So let’s keep today’s pull back in perspective and realize that we are overvalued and could definitely afford to fall a lot further before I would bring my cash out into this market. I saw no reasons today to consider using more capital. A 2.3% decline in this market is hardly enough to bring stocks back to fair value. Indeed most of my stocks fell between half a percent to one percent. Some like Microsoft Stock traded higher for much of the day and in the end closed down just .35%.
Market Direction Closing For Apr 15 2013
The S&P 500 closed at 1552.36 down 36.49 points and the Dow closed at 14599.20 down 265.86 points. The NASDAQ closed at 3216.49 down 78.46 points.
Market Direction Focused On Gold
The plunge in gold is what started the sell-off in stocks. The SPDR Gold Shares ETF (GLD) fell 8.78% on 187 million shares. A huge down day and a huge volume day. The market was fixated on the decline in gold. Gold, silver and resource stocks of all kind were hammered and this shook a lot of investors. You can be sure that when stocks like Barrick Stock were down over 10% there would be margin calls as investors always overdo their buying. Those margin calls on days like today just add to the downward pressure.
Market Direction Russell 2000 (IWM)
Meanwhile the small cap ETF, the Russell 2000 (IWM) fell 3.77% to $90.11. It has been weak lately and just yesterday managed to retest the 50 period moving average. Today it collapsed through it.
Market Direction Technical Indicators At The Close of Apr 15 2013
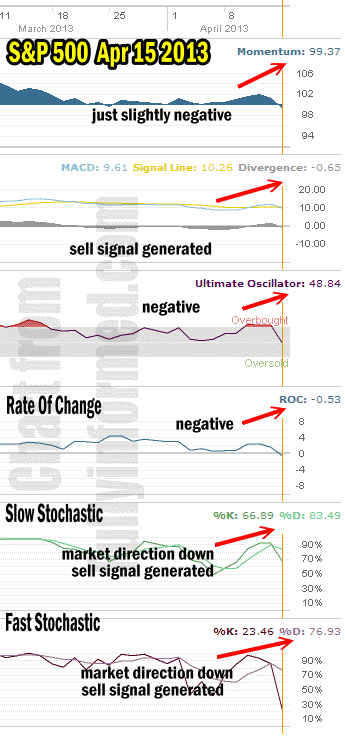
Let’s take a moment now and review the market direction technical indicators at the close of Apr 15 2013 on the S&P 500 and view the outlook for Tuesday April 16.

For Momentum I am using the 10 period. Momentum is now negative but surprisingly only slightly.
For MACD Histogram I am using the Fast Points set at 13, Slow Points at 26 and Smoothing at 9. MACD (Moving Averages Convergence / Divergence) issued a sell signal today and is slightly negative.
The Ultimate Oscillator settings are Period 1 is 5, Period 2 is 10, Period 3 is 15, Factor 1 is 4, Factor 2 is 2 and Factor 3 is 1. These are not the default settings but are the settings I use with the S&P 500 chart set for 1 to 3 months.
The Ultimate Oscillator fell dramatically today reflecting the large down volume. It fell from overbought directly into negative territory.
Rate Of Change is set for a 21 period. Rate Of Change is now negative after falling directly from positive.
For the Slow Stochastic I use the K period of 14 and D period of 3. The Slow Stochastic issued a sell signal on the market today and is showing more downside is ahead.
For the Fast Stochastic I use the K period of 20 and D period of 5. These are not default settings but settings I set for the 1 to 3 month S&P 500 chart when it is set for daily. The Fast Stochastic at Friday’s close had issued a warning that selling would continue today. It certainly was not wrong. It has confirmed the sell signal from Friday and is indicating more selling will follow on Tuesday.
Market Direction Outlook And Strategy for Apr 16 2013
The market direction at the close of today was decidedly negative. This means we could see a bounce back in the early going and then more selling. No one can predict whether the selling tomorrow will be worse than today. Instead the same strategy remains. Stay with large cap dividend paying blue chip stocks. Sell puts only at strikes you would own the stock at. Be prepared to roll your puts lower. I will be considering naked calls but only far out of the money in case of a snap back. For my core positions I am hoping for all my covered calls to now expire out of the money which would be very nice. For other positions a 2.3% decline is not enough to get me placing covered calls in the money yet. I use the 50 100 200 moving averages strategy to determine if a market direction change is upon us and there is no sign of that at present.
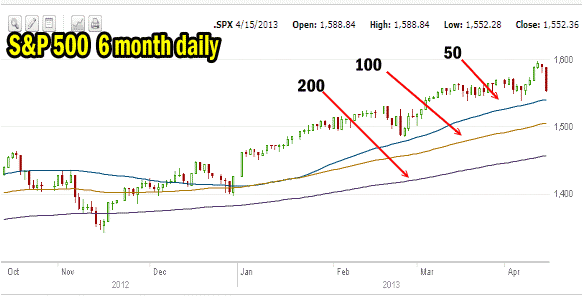
The S&P 500 market direction chart for the past 6 months shows that the 50 day simple moving average is sitting at about 1535. The 100 is about 1515 and the 200 is around 1480. I use the bear market strategy I outlined in the members section here, aptly titled “Market Direction – How I Handle A Correction”. I have found it works very well and is consistently beneficial to my portfolio.

For investors who never want to own stocks but sell puts for income, closing early is never a mistake following big down days. Tomorrow if we see a bounce back it is an opportunity to close positions. But when the goal is not to ever be assigned it would be prudent to wait for clear signals that a deeper correction is not in the works before placing capital at risk.
Tomorrow then we will probably see an attempt to bounce back in market direction. But technical damage was done today and normally it takes time to recover from this type of day. Weakness tomorrow should include more selling and another negative day for stocks. I will be using my Spy Put Options again tomorrow. Today’s Spy Put Options trade was excellent but I sold too early and missed out on a lot more downside than I expected. Maybe tomorrow I won’t make the same mistake!
Internal Market Direction Links
Profiting From Understanding Market Direction (Articles Index)
Understanding Short-Term Signals
Market Direction External Links
