Market Direction last week was all downhill until Friday when Congressional leaders decided to meet with the President and discuss how to resolve the “fiscal cliff” that has worried investors since Obama won re-election. Lots of issues face the economy and the stock markets including taxation changes and possibly even a much needed overhaul.
On Friday morning stocks continued their slide until House Speaker John Boehner said that he had had constructive talks with President Obama and more importantly Nancy Pelosi the Minority Leader of the United States House of Representatives spoke about Wall Street by name. That turned the market direction around and the day ended with the market direction solidly up by the close.
Economic reports however were not very encouraging on Friday with US Industrial production down 0.4 % for October whereas analysts were expecting a small gain. Personally I believe Hurricane Sandy had more to do with the numbers than economists are willing to admit.
But while most analysts believe the fiscal cliff was the real reason behind the stock market sell-off after President Obama was re-elected, I still think a lot of stocks were over-valued going forward from here and the markets needed to pull back and consolidate. So far the S&P 500 Stock Market Index is down about 8% which is a normal correction in a bull market.
Oversold Market Direction
For much of last week my market timing indicators had been signaling a market direction bounce in the works as the stock markets were extremely oversold, but without a catalyst there was no way for the market direction to stop falling. On Friday the comments from members of the House of Representatives after meeting with the President regarding the fiscal cliff and the importance of finding a compromise is all it took to stop the selling.
Market Direction Chart Of S&P 500
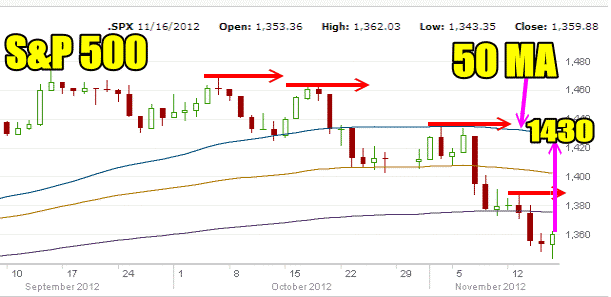
Below is the latest Market Direction chart for the S&P 500 Stock Market Index. The market has made a series of lower highs and lower lows over the past several weeks and now with Friday’s pop higher, the S&P 500 index may finally be reading for a pop in market direction back to the upside.
Any upside action should be traded back to the upside as I believe the index could push back to the 50 period moving average or around 1430 on the S&P 500 index.

Market Direction Chart of the S&P 500 for Nov 16 2012
Trading For Pennies Strategy And Spy Put Hedge
Both of these are momentum or trend strategies. If there is a bounce I will be trading the Trading For Pennies Strategy with a bias to the upside. For the Spy Put Trade it is a hedge and as such I will not be using it if the market direction moves back to the upside.
Can Market Direction Continue Higher?
For the answer to this market direction question lets look at the market timing technical indicators from the close of trading on Nov 16 2012. I have also added the technical timing settings I use for each indicator.
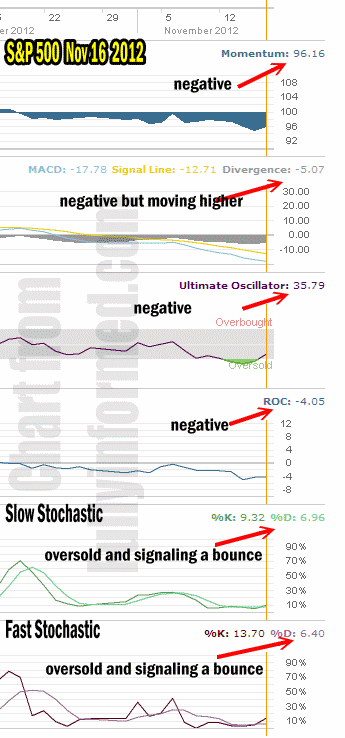
For Momentum I am using the 10 period. Momentum is still solidly negative but as you can see in the chart, Friday’s action has turned momentum back up.
For MACD Histogram I am using the Fast Points set at 13, Slow Points at 26 and Smoothing at 9. MACD (Moving Averages Convergence / Divergence) is still negative and is up just slightly from Thursday’s close.
The Ultimate Oscillator settings are Period 1 is 5, Period 2 is 10, Period 3 is 15, Factor 1 is 4, Factor 2 is 2 and Factor 3 is 1. These are not the default settings but are the settings I use with the S&P 500 chart set for 1 to 3 months.
The Ultimate Oscillator is still negative but Friday’s push higher in market direction has moved the Ultimate Oscillator out of oversold.
Rate Of Change is set for a 10 period. Rate Of Change is still negative but flat from Thursday.
For the Slow Stochastic I use the K period of 14 and D period of 3. The Slow Stochastic is oversold but now points to a bounce back.
For the Fast Stochastic I use the K period of 20 and D period of 5. These are not default settings but settings I set for the 1 to 3 month S&P 500 chart when it is set for daily. The Fast Stochastic is also oversold but it too points to a bounce back higher.

Market Direction Outlook And Strategy
The market direction outlook for the start of the week is obvious. Challenges remain but the extremely oversold conditions of the stock market combined with Pelosi’s comments about Wall Street mayhave stalled the decline and might have brought a bounce in market direction for the start of the week. The Fast Stochastic is not reflecting a huge bounce but certainly a market direction bounce to start us off. The Slow Stochastic however is indicating that while we could see a bounce, the overall market direction bounce may be not strong.
Investors will be wary of any bounce back in the stock market direction at this point but I believe all the talk about the fiscal cliff is overdone to the point where the media has done a good job of worrying investors.
Any bounce back in market direction will be more noticeable in stocks like Intel Stock, Apple Stock, Microsoft Stock as others in the tech sector as they are very oversold. For those interested in a quick trade buying call options into January a couple of strikes above Friday’s closing price may produce decent results if using a stop-loss.
I will be using any change in market direction as an opportunity to close any naked puts that I feel have provided decent returns to raise more cash levels. If a market direction push gets strong enough the S&P 500 Stock Market Index could try to take out the 50 period moving average and I would want to have more capital available for what I believe could be a second pull back once any rally slows or stalls out.
Market Direction then for the start of the week is for the market to test the support from Friday and then move higher.
Internal Market Direction Links
