In my weekend comments on market direction I discussed how the bulls needed some help to get a bounce going. The market direction bounce came partly from retails sales that were higher than expected and by New York region manufacturing which rose slightly as well. None of the numbers were big but they were enough on the upside to get a rally ignited. The banks then followed through and rose, pushing the Dow index higher. The biggest drag on market direction remained AT&T. T- stock continued to fall as telecom stocks in general are suddenly out of favor. I have continued Put Selling T Stock today. The NASDAQ finally had a decent day and that too helped. Even beaten up Intel Stock posted a very nice gain on the day.
Market Direction Buoyed by Earnings
Earnings from companies who have reported the next quarter are overwhelmingly beating the lowered expectations of analysts. Fully 63% of the 32 companies who have reported earnings so far are above expectations. It must be remembered that analysts reduced their expectations for stocks this quarter so many stocks are easily beating these expectations..
Market Direction Pushed By Extreme Oversold Condition
The other market direction catalyst was the extreme oversold conditions I have mentioned for the past three sessions. The oversold condition needed some kind of an igniter to get stocks moving to push market direction higher and all it took was a little bit of good news and no bad news out of Europe, to dampen the rally.
Market Timing Technical Indicators
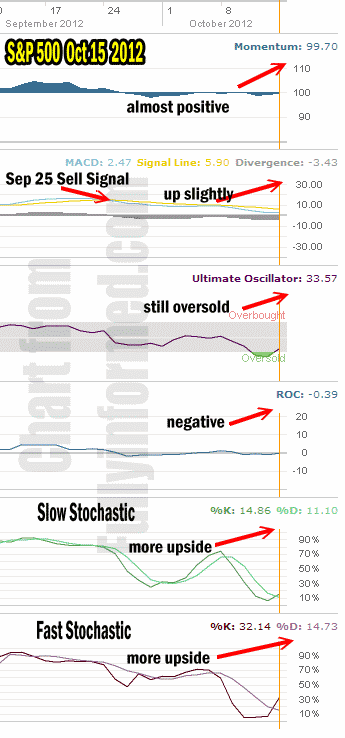
The market timing technical indicators look a lot better at the close today.
Momentum is almost positive and one more day of market direction up and momentum will be positive.
MACD which gave the original sell signal on Sept 25 was up just slightly but is still negative.
The Ultimate Oscillator is still oversold.
Rate of Change remains negative but one more day of market direction up and it too will be positive.
The Slow Stochastic is turning back up and is signaling more upside ahead. It is not very bullish but it is showing more upside ahead and that’s what counts.
The Fast Stochastic is a bit more optimistic than the slow stochastic and it is reading K period 32.14 versus the D period of 14.73. Tomorrow should be another up day for stocks.

Market Direction and determined by market timing technical indicators
Market Direction chart
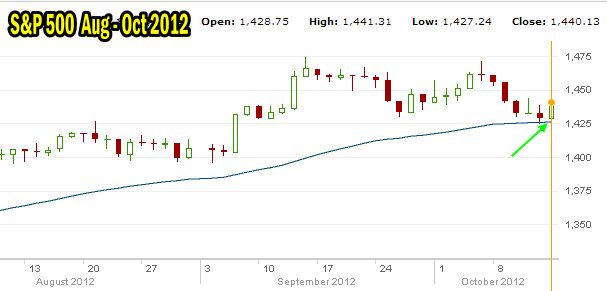
The S&P 500 hit the 50 day moving average and bounced. This is very important but from here it must maintain that bounce and move higher. The 3 month chart below shows the bounce off the 50 day moving average. Technically stocks are still strong and the index has momentum behind it.

The 3 month S&P 500 chart shows market direction bounced off the 50 day moving average
Market Direction Outlook For Oct 15 2012
As the market timing technical indicators show, momentum is swinging back to the upside. To confirm an all clear MACD must turn around and give a buy signal. I noted that William in the Market Direction Portfolio was stopped out on October 9 from his position. I have asked him to update his strategy for Fullyinformed Members and he is working on an article for tomorrow.
If this rally holds it will be easy for the S&P 500 to take out the highs from September. It is important that those highs are broken since in this latest downturn the S&P, Dow and NASDAQ indexes all broker their higher lows and higher highs climb from the start of June. The next step in our market direction outlook will be to watch the rally for Tuesday and see how strong it becomes. The rally must be strong enough over the next few days to be convincing and show that market direction is back up.
