Market direction is at the best of times a best guess scenario. But after 4 decades of investing I know a market in trouble when I see it.
The NASDAQ market is pointing to lower lows and signalling that the market is in serious trouble. The news from Germany was reasonably good news as was the revised USA GDP at 1.3%. Unemployment news wasn’t as bad as expected, although at this point I would take any numbers mentioned as verging on sheer gossip. Housing despite what the numbers may show is I believe in worse shape than earlier this year.
But it is the NASDAQ that I have focused on for the past month and it is not performing as well as the DOW or S&P. In fact there are bear flags everywhere warning that the market direction is DOWN.
MARKET DIRECTION – The NASDAQ Points Lower
Yesterday (Sep 29 2011) was among the worst. At one point the opening gain of 2% ended up as a loss of 2.3% before the NASDAQ recovered to close down 1.6%. In other words, the NASDAQ swung 4.3% in the day. Only 5 NASDAQ stocks set new highs while 211 hit new lows. Think about – 211 hit NEW LOWS. You can view the NASDAQ highs and lows here. (Note this link goes through an ad first)
You can also view the market direction of the last 6 months of the NASDAQ through this link. (Note this link goes through an ad first)
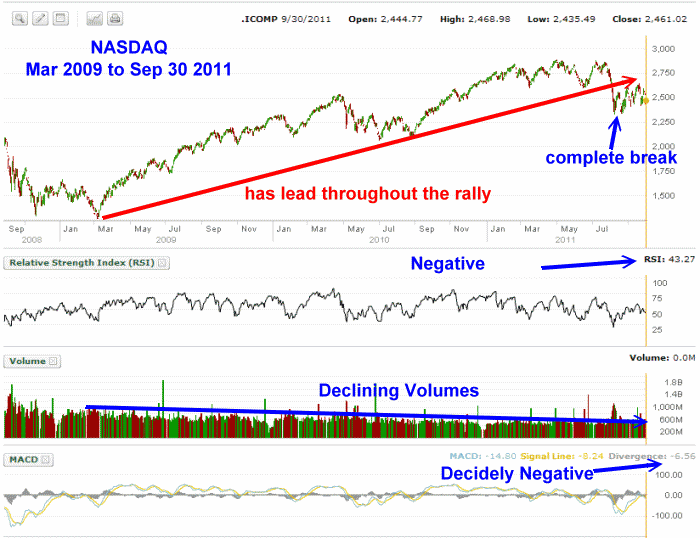
The NASDAQ led this recovery from the March 2009 lows. In the chart below you can see the great recovery in the NASDAQ which moved ahead of the Dow Jones and S&P 500, leading both those indexes higher.
That move has stopped. Relative Strength Index remains negative, volumes are declining and have been for some time, and MACD (Moving Average Convergence / Divergence), is decidedly negative with a reading of negative 6.56.
All of this is telling investors a lower low is coming.
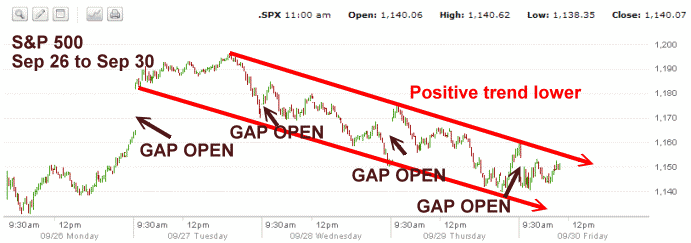
Here is the S&P 500 chart for just the past 5 days. Every day has seen a gap open. These are all bear signs. The positive trend is LOWER.
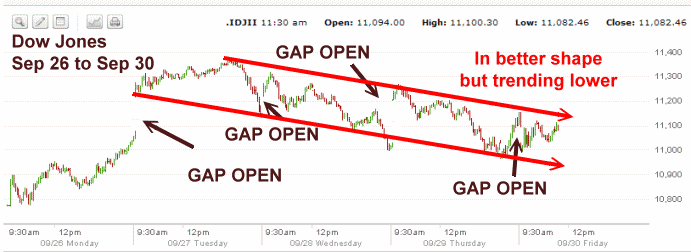
Here is the Dow Jones Chart for the last 5 days. The Dow Jones is in better shape than either the S&P or the NASDAQ charts, but again the market direction trend is positively LOWER.
Market Direction Summary – Mid-Day On Sep 30 2011 – Lower Lows Coming
I reported in my market direction call last night that the August 9th low will be broken by the constant nervousness of investors. Every pullback investors who bought at the August 9th low are becoming increasingly alarmed.
This means that each pullback has seen less and less support. The NASDAQ is telling investors that the market direction is lower and it will break the August 9th lows.
I bought SPY Puts this morning on the market rise. This market will move lower before it establishes a new support zone. I still believe the S&P 500 will try to find support around the 1000 level. That is still about a 140 points lower or 10 to 12 percent lower. I have purchased SPY Puts this morning which I may hold over the weekend.
The market direction I believe has become clearer with this last half-hearted rally and it is definitely lower.


