The information released this morning from the Weekly Initial Unemployment Insurance Claims certainly points to strength once again in the employment category. The claims fell to 284,000 from 303,000 last week. The latest Weekly Initial Unemployment Insurance Claims reports have been showing numbers that reflect the market conditions prior to the stock market collapse of 2008 to 2009. Today’s numbers are now the lowest since 2006, two years before the bear market got underway.
Problem With The Numbers
The problem is analysts are back bashing the numbers citing smaller auto plant shutdowns this summer versus other summers which they say reflects on the Weekly Initial Unemployment Insurance Claims and makes them less reliable indicators of just how well the job market is actually doing. Whatever the case, all the numbers do show is that more Americans are finding work and that is what matters. If they are not laid-off over the summer break for retooling then it means more salaries are being paid and more money is being spent. So whatever the analysts indicate, the jobs numbers are telling us that more money is available in people’s’ pockets as more people are working.
Ford Q2 Earnings
Meanwhile Ford announced earnings of .40 cents per share versus an estimated $0.36 cents per share of revenue of $37.4 billion which was also higher than estimated.
Flash PMI Readings
Finally, flash PMI readings continue to show strength is back growing within a number of important economies. Germany’s flash PMI jumped to 55.9 in July which marked the highest level in 3 months and points to an expansion of their economy despite earlier reports last month showing the economy may be contracting.
France’s economy definitely showed signs of contracting last month but this month it jumped to 49.4 which is still in contraction mode but points to the highest level in 3 months as well.
China’s PMI jumped to an 18 month high of 52.0 in July beating analysts estimates of 51.0.
S&P Market Direction – Morning
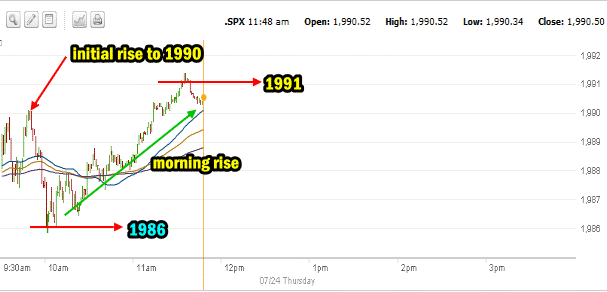
The one minute chart this morning shows only a small amount of selling pressure. The opening saw the S&P jump to 1990 and then the market moved lower into 10:00 AM at 1986. Once that level held buyers stepped in and once more pushed the S&P back above the early morning high to just above 1991.
The morning rise marked an excellent Trading For Pennies Strategy trade which I will post shortly. Meanwhile this marks another day where the early morning high was broken with a higher high before the lunch hour. In prior days we have seen the early morning high mark the highest level for the day and the rest of the day the markets basically trended sideways. The higher high this morning continues to show money is being applied to stocks from investors as earnings continue to come in which for the majority are above estimates.

Advance and Decline
Momentum continues to favor the market moving higher with 1.2 billion shares already traded this morning and 62% of that volume was up. Meanwhile though the number of new highs is at 162 and new lows at just 12 but actual advancing issues are 55% versus 44% that are declining. So while volume looks bullish and new highs looks bullish, advancing issues shows that there are still a large number of issues that are declining with 41% of all issues this morning still declining, just not setting new 52 week lows.
Hating The Rally
The present bull market has to be one of the most hated bulls I have ever encountered since starting to invest in the early 1970’s. I have read countless articles warning investors of doom and gloom since the bear market ended in early 2009. It is truly a shame that more analysts do not understand the power of options to assist in building a portfolio as well as protecting it. More investors could have been in this market making some of the best returns I have seen since the 1970’s.
With so many analysts waiting for the next big collapse, it’s hard to say when a meaningful correction will occur simply because there are too many analysts warning of impending disaster. They will at some point be correct but at present the outlook is for the S&P to hit 2000. That is pretty amazing considering that on March 9 2009 the S&P hit an intraday low of $672.88, which when the S&P reaches 2000, means a gain of 1327 points in just 5 years 4 months. Meanwhile my portfolio almost doubled by the end of 2009 and since 2010 it has tripled thanks to what is the most hated bull market I can recall.
SPX Market Direction Outlook Into The Afternoon
Numbers though continue to look good for the market direction to keep pushing higher. The likelihood of the S&P reaching 2000 is good. Whether the S&P reaches that threshold this week is a guess at present but based on the numbers showing, it will be a grind higher if 2000 is reached this week, which is actually often better for stocks than jumping higher and then backfilling to make up for the big gap ups.
Overall I see little that advises I should stay very cautious. The stance at present continues to be, apply capital but take on smaller positions and wait for dips to occur before entering larger positions in trades.
Internal Stock and Option Trades Links
Put Selling Strategies For Members
Covered Calls Strategies For Members
Profit And Income Strategies Index
Stock and Option Strategies For Members
Stock And Option Trades Explained For Members
