Market Direction remains a key component of successful stock investment and trading options. But for some reason many analysts seem to disagree. Today I read an interesting article arguing that Market Direction didn’t matter. Instead the author went on to say that market timing was next to hocus pocus and investing in quality stocks mattered a lot more than predicting market direction. The author though did not mention how to decide what quality stocks to choose and criteria to set out for stocks to meet to be judged as a worthy stock investment.
I have to disagree. No matter how great the stock investment, market direction impacts all stocks. It is rare when a stock does not follow a correction lower. Market direction is paramount to successful stock investment and trading options profitably.
On Thursday last week for example, my market timing indicators showed that the market direction was still up. There were warnings to be sure, but in general the bias from market timing was for the market to continue higher.
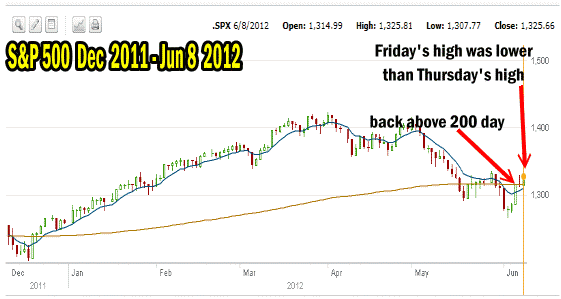
Market Direction Chart Of S&P 500
While the S&P 500 actually closed at the high on Friday, it did not close above Thursday’s high. Normally this would be a warning sign and indeed the Candlestick from Thursday which was bearish, was still valid on Friday leaving the S&P with a possible sell signal on Friday. This sell signal would have to be confirmed on Monday before a full-blown sell signal is issued.
200 Day Moving Average Is Crossed
The 200 day moving average was crossed solidly on Friday and the S&P 500 closed above the 200 day moving average. This is significant and now the S&P must push back to the 100 day moving average to prove that it has broken the resistance at the 200 day moving average.

Market direction chart from Dec 2011 to June 8 2012. The S&P 500 closed above the 200 day moving average.
Market Timing Indicators Say Otherwise
However the market timing indicators I use claim market direction is in fact still up and should move higher in the next week. They refute the candlestick timing system. This has always been a problem I found with candlestick market timing. Instead I prefer my 6 market timing indicators and usually I can take the majority consensus to predict market direction.
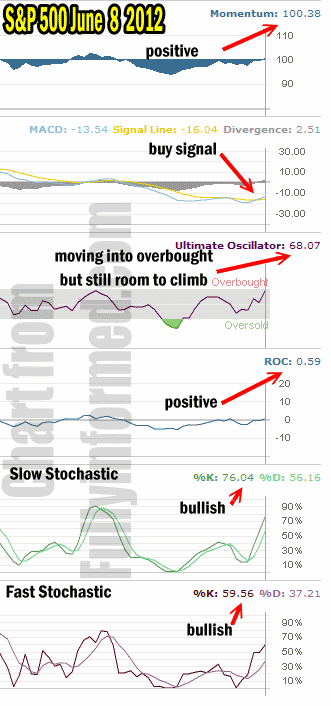
Below are the market timing readings from Friday June 8 2012.
Momentum market timing indicator is now positive! The reading of 100.38 is the best reading since April 24 when momentum was 100.98. The last time momentum was positive was May 3 when it read 101.06 before slipping into negative territory.
On Thursday MACD (Moving Average Convergence / Divergence) had given the first positive reading in a while but on Friday that positive reading have jumped to a buy signal. The reading on Friday was 2.51.
The Ultimate Oscillator which remains my favorite market timing tool is quickly rising now, with a reading on Friday of 68.07. It is getting close to overbought but there is still room for it to climb higher.
Rate of Change on Friday went positive with a reading of 0.59.
Slow Stochastic which on Thursday had insisted that the market direction was up, moved even higher on Friday and is starting to reach for overbought territory. Fast stochastic followed the slow stochastic market timing tool and indicated market direction higher for Monday with a very bullish reading. The Fast Stochastic is already into overbought territory but is indicating that the market direction will move higher first.

Market timing indicators on Friday predioct that market direction is higher
Market Direction Is Up As Confirmed By Market Timing
Despite all the European problems, market direction is firmly up as confirmed by Market Timing indicators. This means it is time to put away the SPY PUT Trade and stop the hedge of my portfolio until the market timing tools point to trouble. Right now though all the market timing indicators are pushing further into positive territory which indicates that market direction should be higher for Monday and possibly a lot of next week. If this is the case, my June naked puts may all expire out of the money, as stocks could be dragged higher, as long as market direction follows market timing readings and moves up higher.
