In my Market Direction comments back at the beginning of the year I indicated that investors should be aware of the strength that the markets were exhibiting and stay cautious but stay invested. I pointed out that as more bears emerged arguing against the market direction breaking the all-time highs from 2007, that investors should ignore the doomsayers and bears but focus on their strategies and the stocks they are trading.
Today the market direction technical indicators continue to support the outlook that no top is yet in place. By breaking into new highs there will be pullbacks and retests but overall the market direction remains strong. No market direction can go straight up just as no market direction will go straight down but those who predicted a market collapse in February are certainly sitting with losses as the market direction has continued to show strength. Indeed last month as the market direction pushed beyond 14000 on the Dow and above 1525 on the S&P, the number of market put contracts purchased was at a record level which demonstrates just how many professional traders and hedge fund managers were convinced a big sell-off was in the works.
Market Direction Technical Indicators
While I am more than aware that market direction technical analysis is frowned upon by the majority of investors I can only point to the returns I have earned over the years that to some extent there is some truth to them. I have written many articles pointing out that the only way to use technical indicators is to study them each and every day. You cannot simply review them when the moment suits. There are also those who think by looking at the past you cannot predict the future in market direction. What most of these investors do not understand is that the short-term past holds many keys to the short-term future. Longer-term prediction is where the most difficult part lies in understanding predicting market direction as there are too many unknown factors that cannot be taken into account. Therefore predicting longer-term is I believe impossible but really this is unnecessary anyways as it is the short-term that can give the clues as to when to be cautious, when to be out and when to scale back in.
Market Direction Indicators To Watch
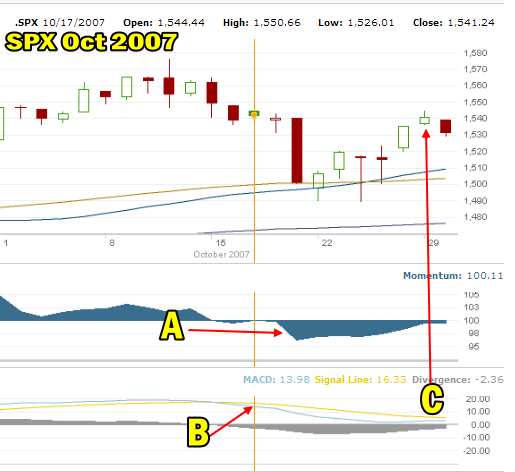
For example in October 2007 as the S&P 500 pulled back from its all-time high MACD gave a sell signal (Point B) and momentum began a decline (Point A). As the market began to rally back which you can see in Point C, momentum refused to support the rally and MACD stayed negative. Two key indicators then warned that the rally back was too weak and would most likely fail.

S&P 500 in October 2007 - daily chart
Those who don’t believe in technical analysis do not understand that nothing is written in stone. There is no “perfect” method of determining 100 percent whether a market top is being put in place and the downturn will be severe. No one can predict that. Instead what you want is for technical analysis to warn when you need to be cautious and when you should remove some capital from your trades. In my case for instance I use Technical Analysis to warn when market direction is in trouble and when I should take smaller positions and be cautious through closing early for less than stellar profits, but to focus on protecting my capital.
Today’s Market Direction Action
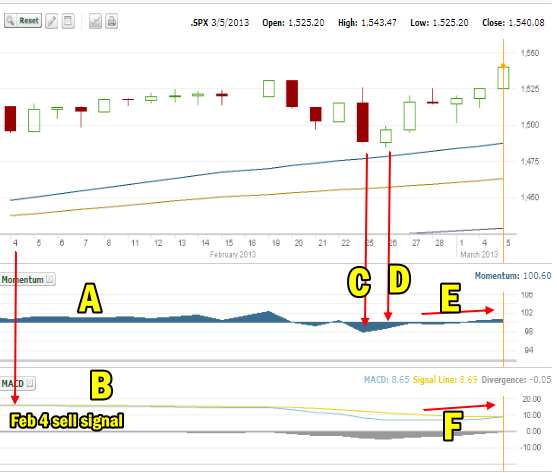
But if we look at the market direction action since Feb 4 we get a totally different picture. On Feb 4 MACD (point B) issued a sell signal on the S&P 500. Meanwhile though momentum (POINT A) continued to stay positive and often moved higher.
Point C was the big down day on Feb 25 which both momentum and MACD warned could continue. The following trading day (point D) the market tried a comeback which improved momentum but only turned MACD sideways.
Since then Momentum (Point E) has continued to climb from negative back to positive and today’s market direction to all new highs is positive in market direction and has turned MACD (Point F) back to almost positive.

Market Direction action in the S&P 500 since Feb 4 2013
These indicators are not saying “all is well” and to jump back in. Instead they are signaling that there is underlying strength and it is worth continuing to stay invested but to stay cautious until MACD gives a buy signal at which time more capital can be committed.
You can understand then why since Feb 4 when the sell signal was generated by MACD I continued to say “stay cautious but stay invested”. The market direction technical indicators offer a lot of clues for those who are willing to use them daily and compare them to the previous days to look out over the next few days.
Market Direction Intraday Summary for March 5 2013
So remember, technical analysis is not about perfect calls on market tops and bottoms, but about understanding how to invest, when to be cautious, when to pull back and when to prepare to implement strategies for both the upside, such as now and the downside, which I am sure we will see sometime this spring to summer.
No market ever climbs forever. There will be a further correction than what we have seen and when that happens my market direction technical indicators will be there to assist me, offering advice of what to expect next and that is all I need to continue to profit within any market direction, up, down or sideways.
So let’s enjoy the profits being brought by the all-time stock market highs today and look forward to future profits no matter what the market throws at us because understanding the short-term market direction outlook is among the best ways to invest both for profits in our portfolios and for safety of our capital.
Internal Market Direction Links
Profiting From Understanding Market Direction (Articles Index)
Understanding Short-Term Signals
Market Direction Candlestick Daily View (Members only)
Market Direction Portfolio Ongoing Trades (Members only)
Market Direction External Links
