Yesterday’s afternoon market direction plunge took the wind out of the recent rally. As expected the market direction tried a bounce back which at one point by 10:00 AM had pushed the Dow market direction up to 13911. But then selling emerged. Before looking at what to expect in the market direction action let’s quickly reflect on some of the events today.
Fed Chairman Ben Bernanke reassured that nothing has changed as far as Quantitative Easing was concerned. He sees no risk on the inflation front and remains determined to get unemployment lower. His statements reflect that the Fed policy minutes which discussed slowing or stopping Quantitative Easing early were simply that, notes only. Investors always tend to over-react one direction or the other and this is just another example of that.
Meanwhile the Conference Board’s consumer confidence readings rose to 69.6 in February a big jump from January’s revised reading of 58.4. Finally the US Housing Market continued to look upbeat with new home sales up 15.6 percent in January and the Case-Shiller home price index in 20 US Cities was up 6.84 percent for 2012.
These are all good numbers and reflect the continued expansion of the US economy albeit slowly.
Market Direction Action Mid-day On The Dow
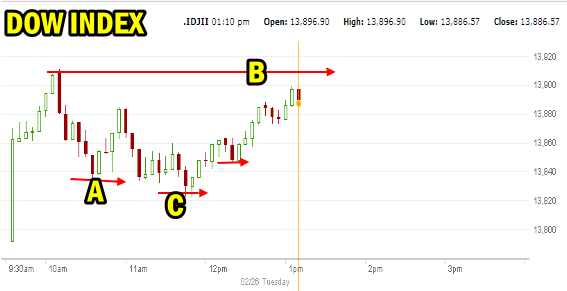
Here’s what I am watching for the Dow Index today. The 5 minute daily chart below shows the gap bounce up in the morning which was to be expected after so much selling yesterday. The other key aspects of the chart as marked below.

Dow Index 5 minute daily chart for Feb 26 2013 to 1:00 PM
A) A pattern of lower lows started the day but then reversed by mid-day which is a good sign of support.
B) The morning high is what the market needs to break into the close to convince investors that the Dow will not fall further.
C) The morning’s low was still above the open which is also a very good sign.
Market Direction Action and Technical Damage
Yesterday’s market plunge as the day wore on, has left behind some technical damage which needs to be repaired for the market direction to shift back to up and stay up. I would expect today that the markets will not close near the morning highs. This would mean more selling tomorrow so I took advantage of today’s market action to sell some covered calls.
Technical damage needs time to repair it and that usually means a move back to support levels which are lower in both the Dow and the S&P.
Market Direction on the S&P 500
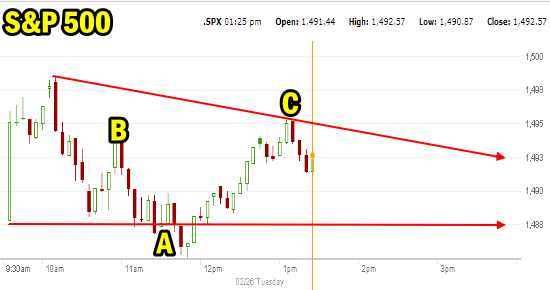
The S&P 500 is a lot weaker than the Dow in today’s 5 minute chart. The morning top has not been recovered and if it should close lower than point C, this would clearly indicate a move somewhat lower for the S&P 500.
Meanwhile, this morning’s opening jump was expected but I did not expect that the S&P would collapse lower than the open, seen at point A shortly before noon hour. This break below the open is a bearish sign of weakness and could be pointing to a move back to the 50 day support which I think is a pretty good guess since a lot of support sits at the 50 day moving average.
Signs of strength in the market direction though can be found with the intraday highs at point B and C as C is still pushing higher than point B. If the S&P 500 can close around point B or about 1492 to 1493 that would be a good sign for the market. But to draw more investors in for another push back up, I do believe the S&P 500 needs to fall back to support at 1475 but hold there. A few days of holding near the 50 day moving average will provide investors with confidence that the market direction will not shift lower and this should bring them back into the market place.
Right now all indications are that the market direction in the S&P 500 will be for the markets not to close at 1493, but lower which will definitely signal I believe, a move back to 50 day support.

Market Direction on the S&P 500 5 minute chart mid-day chart for Feb 26 2013
Market Direction Outlook Intraday for Feb 26 2013
Intraday then, the market direction looks weak and soft which is exactly what should be expected. I see no signs of anything imminent in the way of a market plunge of more than 1000 points as was mentioned on various media outlets. There is underlying strength in this bull market and no signs yet of a typical topping action. There are plenty of signs that the market direction needs to pullback to at least the 50 day moving average to regain strength to push higher into March and/or April.
I am continuing with my cautious approach and am trading stock, selling puts on a select group of stocks and selling covered calls on those stocks that I think present the best opportunities for income and being exercised away. For core positions I would be selling out of the money covered calls but realize that this correction could be very short-term and long-term core holdings that have covered calls sold, may end up having those calls bought back.
It’s nice to see the market direction a little more whipsawed as this is what helps drive up option premiums.
Internal Market Direction Links
Profiting From Understanding Market Direction (Articles Index)
Understanding Short-Term Signals
Market Direction Candlestick Daily View (Members only)
Market Direction Portfolio Ongoing Trades (Members only)
Market Direction External Links
