Market Direction intraday is showing the indexes, particularly the Dow, taking profits. The market direction outlook for today was weakness in the morning and then an attempt to push higher. The S&P 500 however has been sitting just below yesterday’s close for most of the day so far. It should be an interesting close but my bet is still for a push back up in market direction toward the close. Profit taking is going on, on dozens of stocks which is only natural with the S&P 500 so close to its all time high.
Market Direction and Consumer Confidence
When the market direction has had a nice move higher, investors look for reasons to sell. This morning it was the US Consumer confidence reading from the University of Michigan which fell to 71.8 from 77.6 in February. This also marks the lowest reading since December 2011. But US Industrial Production was up rising 0.7 percent which is the biggest gain in 3 months and beat expectations. Inflation remains well in hand with US consumer price index up 2 percent over the past 12 months.
JPM stock is down on news it will face a US Senate hearing while BAC Stock is up over 3.5% on the news of share buy backs. Gold is up just $2 but nearing 1600 again at $1593 an ounce and oil was up 40 cents to $93.43.
Market Direction Action Intraday
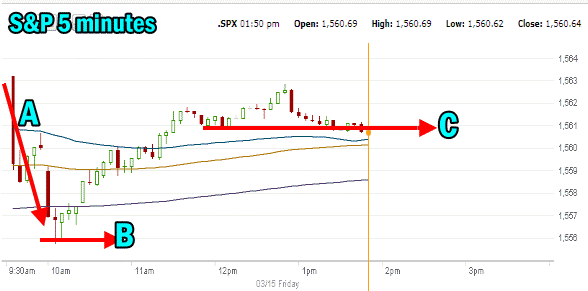
Below is the intraday chart for today. The S&P 500 5 minute chart shows a few interesting things.
A. The drop right out of the open and then typical, a low within the first half hour.
B. The bottom at 10 AM and then a rally back.
C. An intraday higher high but it is being tested at the time of writing this article.

Market Direction 5 minute chart for March 15 2013
Market Direction and Trading For Pennies Strategy
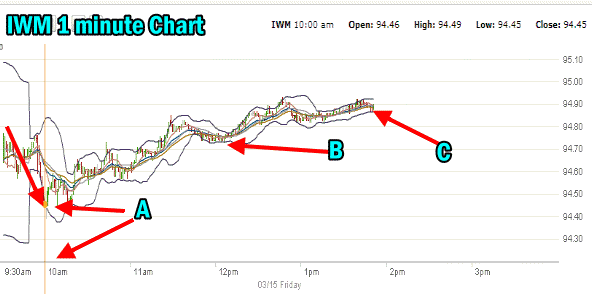
For FullyInformed Members who are doing the IWM ETF Trading for Pennies Strategy trade on the members section, remember to keep open the S&P 500 chart. There are very strong correlations between the two which make it much easier for trading the Pennies Strategy. In particular, the open each day has been very easy to trade and pick up .10 to .20 cents depending on the day. You can see in the 1 minute chart below the similarities.
A. At the open I bought puts and held on as I watched the S&P 5 minute chart above. At 10:00 AM almost on the dot, the S&P bottomed as did the IWM ETF. I sold and picked up .10 cents which on 60 put contracts which wvasa $600 trade for about 25 minutes work.
B. A very nice recovery and a much more profitable trade for anyone who could hang on that long. I did not do any calls after my put trade. Note how point B on the IWM ETF 1 minute chart below coincides with the Point C on the S&P chart at 12:00 PM.
C. The IWM ETF unlike the S&P 500 was still pushing higher at the time of writing this post which is a good indication that the S&P may try to close higher for today.

Market Direction and the IWM ETF 1 minute chart
Market Direction Portfolio
I see that this morning Doug Harris bought back into his market direction portfolio. I sent him an email wondering if he could give members an update on his market direction portfolio and plans.
Market Direction Intraday Summary
For today then I am expecting the market direction to try to push to a new high for the S&P 500. I won’t be surprised if the Dow fails to close higher though. Meanwhile I hope FullyInformed Members doing the Trading For Pennies Trade remember to keep a good eye on the S&P 500. You can definitely benefit by watching the S&P 500 overall market direction and remember, that first half hour is often a sweet spot for a very good Pennies Strategy trade.
Internal Market Direction Links
Profiting From Understanding Market Direction (Articles Index)
Understanding Short-Term Signals
Market Direction Candlestick Daily View (Members only)
Market Direction Portfolio Ongoing Trades (Members only)
Market Direction External Links
