I have often said that Market Direction is the most important part of investing. Staying with the underlying trend of the market direction is important especially when it comes to Put Selling against stocks. The ongoing correction is showing many investors that market direction is paramount for successful trading. While 1600 was the first level of real support for the rally from January, once it broke, the market direction quickly has picked up steam to the downside. It’s obvious from trades such as my Spy Put Options which almost tripled in value within just two days once 1600 broke.
Next Support Level is 1540
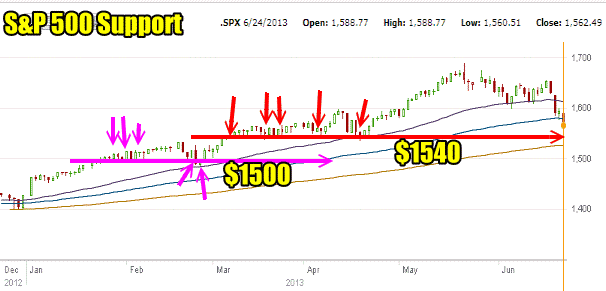
If you look at the S&P 500 market direction chart below you can see that once 1600 broke the market has quickly collapsed beyond the 100 day exponential moving average (EMA). In my members article on How I Handle A Correction I indicate the importance of the 50, 100 and 200 day moving averages and why a strategy should be built up around those moving averages. Thedaily chart for the past 6 months below shows the two remaining key levels of support. 1540 is the strongest support level. You can see by the red arrows how long it took for the market direction to re-test that key support level and then finally push higher.

1600 Was Important But…
The 1600 level was important to the market direction move higher but it is nothing when compared to 1540. The 1600 level as you may recall from the market direction article of June 14 entitled “What Me Worry?” marked the continuation of the January rally. In that article I had written that if 1600 held then the market direction rally from January remained intact, but once if it broke, then that would signal the end of the January Rally. Support was not strong at 1600, but there was some support there.
When you look at the above chart you can see that 1600 had little support in relation to 1540.
Key Support Is 1540
The key support level is at 1540. From March 5 when the market direction climbed to 1540 right straight through until April 22 when it began to climb to the next support level, the market direction spent 7 weeks retesting and checking 1540. A large amount of support was built up over that 7 week period. You can be sure a lot of institutional investors are in around this level on many stocks. 1540 is the real key to the January rally. If 1540 breaks, investors will bail on this rally and knock through the final support which is weak at 1500.
Watch For Price Action
Be careful at this point in the correction. If using the bear type or ultra short type ETFs, take profits when they appear and re-enter positions when markets rally back. I am expecting a lot of action at the level between 1540 and 1570. The key though remains 1540. If that line breaks I will be buying Ultra Short ETFs and Spy Put Options for the ride lower and then be looking for the market to fall back to around 1400 which is long-term support from 2012.
No Market Direction Crystal Ball
There really is no long-term market direction crystal ball. Just a few weeks ago analysts were calling for 1700 on the S&P as easily reachable by year-end and who knows perhaps it will be. It is important though to keep the focus where it belongs and that it on the present market direction which sits precariously just above the key support level that will control the entire January rally. If the January rally should be broken then I believe stocks will move lower and if investor confidence is shattered in stocks, no matter how good the next quarterly earnings are, investors will be too cautious to push stocks to new highs.
I don’t believe anyone can advise where the markets will be later this summer or into the fall. I do believe in support levels and I know from experience that when a key support level is broken, investors use any rally back up as a selling opportunity to unload stock they failed to sell on the initial pull back. As well 1540 on the S&P 500 is sitting just above the 200 period exponential moving average (EMA) which in itself marks longer term support for the entire market direction. If 1540 breaks the 200 period will definitely be breached and that will mark a full blow correction which this market has not seen since last year.
That tells me that all eyes should be on 1540 and I know that I will be trading daily as I look for trade opportunities but I will be keeping a focus more to downside action such as I am doing with my Spy Put Options trades and the market direction portfolio. I have not had a lot of time for IWM Trading For Pennies Trades but I would still be staying to the downside especially off any market direction rallies which have to be suspect until firm support is established and I know that the 1540 level can hold.
Market Direction Internal Links
Profiting From Understanding Market Direction (Articles Index)
Understanding Short-Term Signals
Market Direction Portfolio Trades (Members)
Market Direction External Links
