Market Direction bounced back today but I do believe staying cautious is warranted. The roller coaster stock market ride can be difficult on nerves of investors and yesterday’s knee-jerk reaction to the possibility that the economy was not doing as well as expected and Europe woes might enter the picture again seemed to catch a lot of investors off guard.
CNBC commentators and analysts alike seemed torn as those who just a day or two earlier were bullish on the US economy and stocks in general, turned bearish on the selling. This seemed out of sorts with the reality of investing which is that stocks cannot go straight up and neither does the market direction.
Market Direction and Put Selling
By staying with a combination of stocks and options and being aware that there will be pull-backs in market direction, I feel fine going into the rest of the year. Keeping some cash on hand always has worked for me and it assists in keeping my portfolio ready for any opportunity such as yesterday doing the SPY PUT trade on the downturn. By continuing to look for Put Selling opportunities, such as yesterday and grabbing those I am continuing to grow my portfolio. Rather than holding naked puts until expiry, when markets become a roller coaster ride, I find it best to buy to close for profits as they appear and keep my cash levels a bit higher. This simple strategy of Put Selling and buying to close for profits rather than waiting for expiry has worked well during market direction tops such as in 2007 and 1999.
There are though many clues as to when a bigger pullback in market direction than yesterday can be expected.
Market Direction Topping Action
Right now there is still no market direction topping action in the S&P 500, Dow or the NASDAQ index. This is primarily because earnings have been stronger than expected in the latest quarter which has helped to keep pushing the market direction higher as investors keep buying stocks.
Market Direction Lower Highs
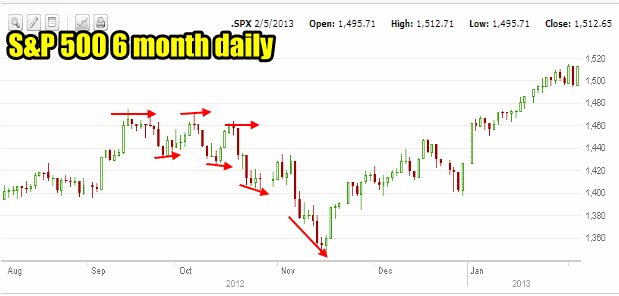
But if we look back to the early fall 2012 you can see the signs that you should watch for with the latest push higher. In the fall we had 3 topping actions. The third topping action was lower than the other two. This sets up the lower highs scenario which is a classic pattern that has been around since stock markets were created. It basically shows that investor interest in owning stocks at ever higher prices is declining.
Market Direction Lower Lows
In the same 6 month daily chart below you can see the lower lows pattern from this past fall into mid November. Again a classic pattern that investors should all be aware of.

Market Direction August to February daily chart of the S&P 500
You can also profit handsomely from watch for this pattern. For example by the third top in the chart above, buying an ultra bear ETF or buying SPY PUTs can yield substantial returns. It’s an easy trade to do and an even easier pattern to spot.
Market Direction Rally Review
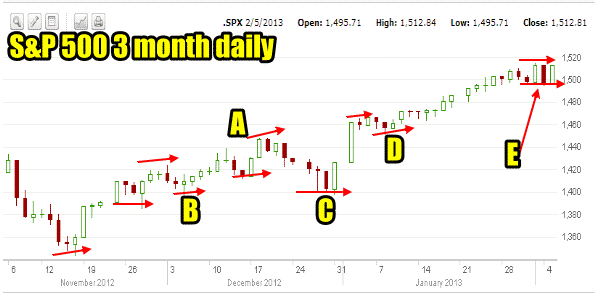
You can see that clearly we do not have any such patterns in the latest rally from the mid-November low.
A. A pattern of higher highs had developed which technically supported the market direction continuing higher.
B. A pattern of higher lows had developed until point C which again is technically a good sign of market direction strength to the upside. Basically higher lows means that investors are busy buying the dips or the lows and are pushing the overall market direction higher.
C. Point C was a period of a short sell-off as investors worried about the fiscal cliff dilemma. As soon as it was resolved the pattern of higher lows immediately re-emerged at point D.
E. Here is where we are as of Feb 5. We have had 3 days of back and forth roller coaster rides. Certainly part of this is the economic news yesterday, but a lot of this is also investor sentiment. There are many who are selling out of positions here or certainly closing portions of their positions. Part of it also is resistance as the S&P 500 is now back above 1500 and many stocks are pushing into new 52 week highs and investors who have held stocks since 2007 and 2008 are getting out of their positions and many are thanking their lucky stars that the market has recovered.

Market Direction Rally November to February on the S&P 500
Market Direction Intraday Summary for Feb 5 2013
It’s obvious right now that there are no clear signals of a market top being put in place. That could change in a few days but even if it does there will be retests and rallies back as the market direction tries to decide which way the market direction will go. Right now earnings are strong. In 2007 they were declining. Right now unemployment is falling. In 2007 it was rising. Right now interest rates are at zero. In 2007 they were climbing. There are of course lots of headwinds and events to come that could end the rise in the market direction, but there will be time to buy protection or enter trades to profit from the downside as well. Until that happens, days like yesterday are excellent opportunities to do more Put Selling and for me, my Spy Puts Trade is the tool of choice to grow my profits.
Once we all see the topping signals as I pointed out in the first chart above, that will be the time to start becoming concerned. Until then days like yesterday are going to happen and there are more of them up ahead as well, but time remains on the side of those investors who daily take a moment to reflect on the simple pattern of higher highs and higher lows. When that breaks, get ready for more profits to the downside.
Internal Market Direction Links
Profiting From Understanding Market Direction (Articles Index)
Understanding Short-Term Signals
Market Direction Candlestick Daily View (Members only)
Market Direction Portfolio Ongoing Trades (Members only)
