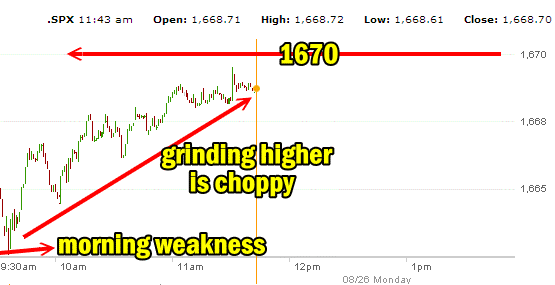
Intraday for August 26 2013 the market direction is putting on a good show. The one minute chart below shows the morning action. The little bit of weakness right at the open was met by buyers who remain determined to push the market direction higher. Once the 1650 was recovered on August 20 after the market closed just below 1650 the day prior, (Aug 19) investors were back picking through those stocks that had tumbled the most. This has brought the market direction back up and the action over the past several sessions has been better. It’s nice to see the market direction grinding higher in a choppy fashion. Investor enthusiasm for the bullish side has pulled back dramatically over the past week which is a good sign for the market direction pushing back higher. Just three weeks ago the bullishness in the market was sitting back at very high levels. It is rare when the majority of investors are right and once the market direction turned back down, bulls began to turn to bears.
S&P 500 Market Direction Action
At present 1670 is the next goal for the bulls and as we can see in the 1 minute chart below, this morning the S&P 500 is close.
Bulls and Bears On Market Direction
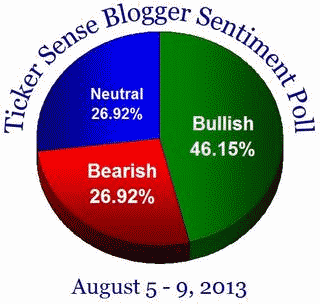
One of the more interesting ways of looking at bulls and bears as a contrary indications is the website Tickersense which surveys various market direction blogs to get a general consensus. For example below is the blogger sentiment poll from Tickersense which shows the bullishness at 46.15% and bears at 26.92%.
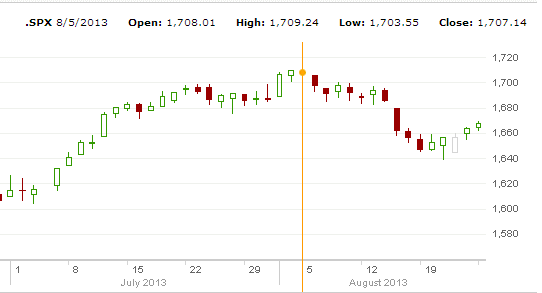
Looking at the S&P 500 chart you can see that the bullishness was wrong and this actually marked the end of that rally and the beginning of what may turn out to be a shallow 3% correction.
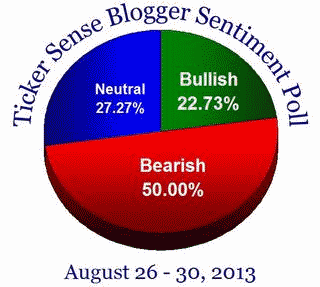
This week the amount of bullishness is now down to less than half with a reading of just 22.73% and a giant jump in bearishness to 50%. Using the contrary investing outlook means that the market direction may indeed move back up with so many investors believing it will fall lower.
Market Direction Outlook Intraday August 26 2013
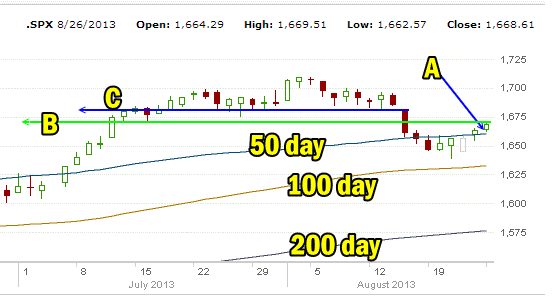
Intraday there are a few things to be watching for. The two month daily chart of the S&P 500 below shows what I am busy watching.
A. Today I want to see the S&P 500 close back above the 50 day simple moving average (SMA). Then it must hold this for Tuesday as well. It cannot close ON the 50 day today but must close near the highs for today and ABOVE the 50 day simple moving average (SMA) to actually signal that the market direction will attempt to push back up.
B. The next level that MUST be reached by the market direction up is the 1670 level. This morning we got close at 1669.51. But 1670 is now resistance and the market direction has to recover this by Tuesday, otherwise the market direction will, I believe, fall back to around the 1650 level and then may try to restage another rally to take 1670. If the market direction up, can retake 1670 today or Tuesday then momentum should remain to the upside. If not, then momentum will grow to the downside. A push above 1670 should turn the overall momentum back to positive from negative and this should be reflected in my nightly technical outlook for the market direction.
C. The tougher level will be 1680. This level was tested and retested MANY times in July and early August. It is stiff resistance now. If the S&P 500 can push market direction hard enough to break through 1680 quickly, then I believe the market direction will push higher and the correction will be over.
Market Direction Intraday Summary for August 26 2013
Right now the market direction up is definitely underway. The rally I had expected since Wednesday has been ongoing. This will mark the third day of and upward bias in market direction. A rally off the oversold readings from mid-week last week should begin to run out of steam today or tomorrow IF the rally was nothing more than a bounce back from an extremely oversold level.
The level I am watching is 1670. From there it will be 1680. Those two lines in the sand must be broken this week and reasonably quickly, otherwise I believe the market direction up will change back to down.
The problem the market direction is facing right now is the Fed intervention through the Quantitative Easing program. The unknown entity of exactly when the Fed will start to scale back their present Quantitative Easing program is keeping investors and therefore, the market direction on edge. The market hates uncertainty but that is ALWAYS what the market direction faces.
The Role Of Market Direction Technical Tools
Technical timing tools attempt to see through the fog of uncertainty to gauge the overall technical strength or weakness facing stocks. While they cannot gauge Fed action and intervention they can still give some degree of strength or weakness which can advise investors the full extent of capital they should be using in their positions. This gives investors a degree of comfort and allows them to continue to invest, earn some income and wait for clearer signals at which time they can put even more of their capital to work.
Pick Your Comfort Level
It comes down to personal levels of comfort. I have a lot of rescue strategies in my investing arsenal so investing in most market conditions does not bother me. I also sell put options which means I am always lower than present values and it allows me a degree of flexibility to roll down, buy back and close, sometimes for a loss but still close a losing position, or to roll out, decrease the quantity on roll outs and work my way lower. I also only sell put options against stocks I would own, sometimes for months to years if necessary to keep the income flowing in and my cash working.
In the present market environment, establish what comfort level you are happy with and can sleep well with and then do not go beyond it. Patience is always key to every market direction environment and this one is definitely no different.
Market Direction Internal Links
Profiting From Understanding Market Direction (Articles Index)
Understanding Short-Term Signals
Market Direction Portfolio Trades (Members)
Market Direction External Links
Market Direction IWM ETF Russell 2000 Fund Info
Market Direction SPY ETF 500 Fund Info
