FullyInformed.com
Generic filters
Exact matches only
Search in title
Search in content
Search in excerpt

Market Direction Outlook For Aug 19 2013 – Heading To 1650

Aug 18, 2013 | Stock Market Outlook

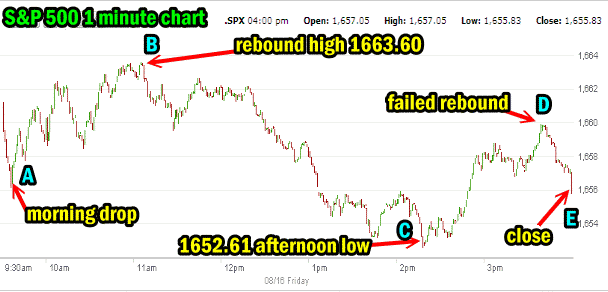
The outlook for Friday was for the Market direction to rebound higher and then close lower.  I had indicated often that I believed if 1670 broke the S&P would quickly move to 1650. If we look at the 1 minute intraday chart from Friday August 16 you can see the morning drop, point A. This was followed by a rebound high to 1663.60 which failed to recover the 1670 level. From that rebound high at point B, the market direction quickly faded to 1652.61 almost reaching the next support level at 1650. I have marked that point as C. From there a second rally to point D failed and the S&P 500 closed lower at point E.

This typical intraday move is continuing to indicate that there is more downside ahead for the upcoming week.
market direction Aug 16 2013

Oversold Market Direction

The push lower however has the market direction oversold and a bounce back may happen as soon as Monday. Any bounce back is suspect at this point in the downturn and should not be assumed to mark the end of the present round of selling.

Market Direction Closing For Aug 16 2013

The S&P 500 closed at 1,655.83 down 5.49 and clearly below the first support level of 1670 and pushing closely toward the second support level at 1650. The Dow closed at 15,081.47 down 30.72. The NASDAQ closed at 3,602.78 down just 3.34.

Market Direction Technical Indicators At The Close of Aug 16 2013

Let’s review the market direction technical indicators at the close of Aug 16 2013 on the S&P 500 and view the market direction outlook for Aug 19 2013.
Market Direction Aug 16 2013

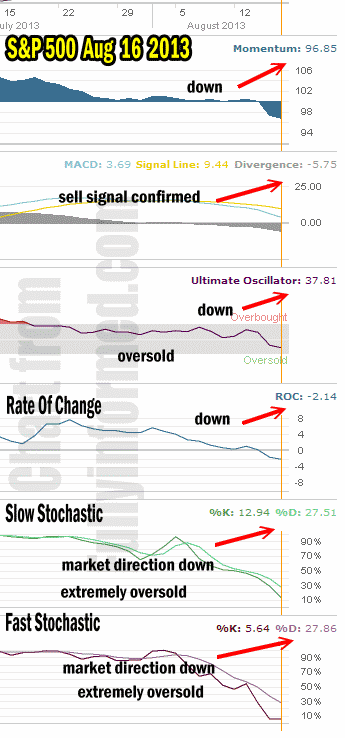
For Momentum I am using the 10 period. Momentum is now decidedly negative.

For MACD Histogram I am using the Fast Points set at 13, Slow Points at 26 and Smoothing at 9. MACD (Moving Averages Convergence / Divergence) issued a weak sell signal on July 31 which was confirmed August 7. MACD is falling deeper into sell territory.

The Ultimate Oscillator settings are Period 1 is 5, Period 2 is 10, Period 3 is 15, Factor 1 is 4, Factor 2 is 2 and Factor 3 is 1. These are not the default settings but are the settings I use with the S&P 500 chart set for 1 to 3 months.

The Ultimate Oscillator is now decidedly negative and reaching oversold levels.

Rate Of Change is set for a 21 period. The rate of change is now also negative and falling.

For the Slow Stochastic I use the K period of 14 and D period of 3. The Slow Stochastic is signaling that the market direction is lower. It is extremely oversold

For the Fast Stochastic I use the K period of 20 and D period of 5. These are not default settings but settings I set for the 1 to 3 month S&P 500 chart when it is set for daily. The Fast Stochastic is indicating that the market direction is down again for Monday but it is extremely oversold so there is some chance of a bounce perhaps to start off the day. Any bounce back up is suspect and should not be believed as indicating the downtrend is over.

Market Direction Outlook And Strategy for Aug 19 2013

The market direction trend is now decidedly lower.  My Spy Put Options trades are doing very well as are the Trading for Pennies trades which are earning good returns thanks to the increased volatility. The VIX Index trades done through VIX Index calls are now up and while Monday could see a decline in volatility I do believe the direction is definitely lower at this point which means the VIX Index call options will grow in value. I will be unloading my VIX Index call options in groups as volatility climbs.

For Monday I will not be surprised to see the market direction push back up. The market is extremely oversold at this point but the trend is lower so any move back up should not be bought into. Instead I believe the 1650 level will be tested shortly and if it breaks the market direction could fall back to 1600 as the first major line of defense for bullish investors.

1650 is important as it does not have the same strength as the 1670 level. If 1650 is tested and fails to hold the market direction from falling further, it should only take a day or two at most for the market direction to break through and head toward 1600. Selling will increase if the 1650 level breaks.

Market Direction Internal Links

Profiting From Understanding Market Direction (Articles Index)

How I Use Market Timing

How I Use Market Timing

Understanding Short-Term Signals

Various Market Timing Systems

Market Direction Portfolio Trades (Members)

Market Direction External Links

Market Direction IWM ETF Russell 2000 Fund Info

Market Direction SPY ETF 500 Fund Info


Recent Outlooks

Stock Market Outlook for Fri Apr 11 2025 – Bounce Likely But Highly Suspect

Prior Trading Day Summary: Thu Apr 10 2025 found stocks selling lower again despite Wednesday’s massive rally as China’s tariffs took center stage again. Nervous investors decided to take profits from Wednesday’s rally. The S&P ended the day down 188 …

Morning Investing Strategy Notes for Thu Apr 10 2025

For FullyInformed Members the morning Investing Strategy Notes for Thu Apr 10 2025 review the massive rally on Wednesday and the outlook for stocks following the change in the tariff stance from the White House. Stocks discussed for today include …

Stock Market Outlook for Thu Apr 10 2025 – Choppy Day With Dips Likely But Higher Close

Prior Trading Day Summary: Wednesday saw a massive relief rally after news of a 90 day reprieve in tariffs and a drop to 10% for those countries that President Trump deemed “friendly” although China, Canada and Mexico were not on …

Morning Investing Strategy Notes for Wed Apr 9 2025

For FullyInformed Members the morning Investing Strategy Notes for Wed Apr 9 2025 review the trading on Tuesday. Stocks discussed for today include the SPY ETF, the VIX, TQQQ ETF, SQQQ ETF,  Constellation Brands Stock (STZ) and more. The morning …

Stock Market Outlook for Wed Apr 9 2025 – Bearish Bounce – Panic and Lower

Prior Trading Day Summary: Tuesday saw a typical bear market bounce that trapped a large number of investors. The early morning bounce seemed strong but volumes were low. When the news came regarding Chinese tariffs the market fell apart. Volumes …

Morning Investing Strategy Notes for Tue Apr 8 2025

For FullyInformed Members the morning Investing Strategy Notes for Tue Apr 8 2025 review the strong rebound on Monday and whether it has any staying power. Stocks discussed for today include the SPY ETF, the VIX, TQQQ ETF, SQQQ ETF, …

Stock Market Outlook for Tue Apr 8 2025 – Bounce Likely But Highly Suspect

Prior Trading Day Summary: Monday saw a wicked start to the day but a rumor on a delay in implementing tariffs stopped the selling despite the White House denying the rumor. In a dramatic reversal the indexes all rallied strongly …

Morning Investing Strategy Notes for Mon Apr 7 2025

For FullyInformed Members the morning Investing Strategy Notes for Mon Apr 7 2025 review the continued sell-off on Friday and the outlook for Monday with stock futures showing a large decline to start the week. Today’s Investing Strategy Notes focus …

Stock Market Outlook for Mon Apr 7 2025 – Bounce Possible At Any Time But Still Bearish and Lower For Now

Prior Trading Day Summary: One word described Friday April 4 2025 – Brutal. The S&P collapsed 322 points ending the day at 5074. For the week the S&P was down 507 points. Truly stunning developments and pushing the SPX through …

Morning Investing Strategy Notes for Fri Apr 4 2025

For FullyInformed Members the morning Investing Strategy Notes for Fri Apr 4 2025 review the collapse of stocks on Thursday and the outlook for Friday. Stocks discussed for today include the SPY ETF, the VIX.  TQQQ ETF, SQQQ ETF and …

Stock Market Outlook for Fri Apr 4 2025 – All About The March Jobs Numbers

Prior Trading Day Summary: Thursday saw stocks collapsing worldwide following higher than expected tariffs from President Trump. At was a brutal day, the worse single day since 2020. The SPX closed down 274 points to 5396 on 7.3 billion shares …

Morning Investing Strategy Notes for Thu Apr 3 2025

For FullyInformed Members the morning Investing Strategy Notes for Thu Apr 3 2025 review the outlook for stocks after tariffs were announced on Wednesday. Stocks discussed for today include Chevron Stock (CVX), Exxon Mobil Stock (XOM), VIX ETF, TQQQ ETF, …

Stock Market Outlook for Thu Apr 3 2025 – Bearish Following Higher Than Expected Tariffs

Prior Trading Day Summary: On Wed Apr 2 2025, investors rallied stocks for a third day on hope that the tariffs being introduced would be lower than many expected. As we found out after the market closed, the tariffs were …

Morning Investing Strategy Notes for Wed Apr 2 2025

For FullyInformed Members the morning Investing Strategy Notes for Wed Apr 2 2025 review the second higher day on Tuesday. Stocks discussed for today include VIX ETF, TQQQ ETF, SQQQ ETF, RH Stock (RH) and more. The morning Investing Strategy …

Subscribe For The Latest News