Market direction last week continued the push higher late in the week on the back of good news from the Weekly Initial Unemployment Insurance Claims with the lowest reading since 2007 before the financial crisis and bear market of 2008 to 2009. Historically when analysts reduce their earnings estimates stocks and market direction tends to move higher as they beat those estimates. This quarter as earnings come rolling in the momentum is building towards many companies beating the reduced earnings estimates. It may seem odd that beating lowered estimates is bullish for market direction but statistically it holds true.
Market Direction and the January Effect
Since 1950 the January effect has been noticed within the S&P 500 an incredible 88.5% of the time. When January rises it sets the trend for the rest of the year. If January suffered losses, it was followed by a bear market. This January effect is felt by all 3 market indexes.
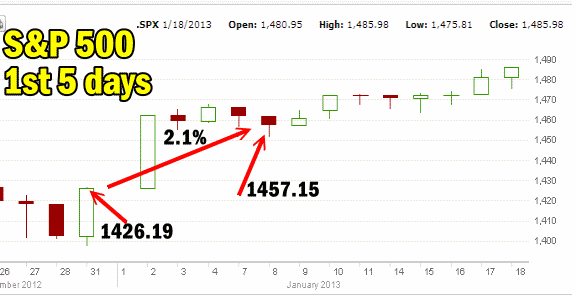
As well the first five days of January if they are result in an up market have also predicted a rise in the markets in 86.8% of the time since 1952.
This past January theS&P 500 first five days were up 2.1%. Presently the S&P 500 is up 4.2% since the start of January 2013.

The first five days of January has indicated market direction for the rest of the year 86.8% of the time.
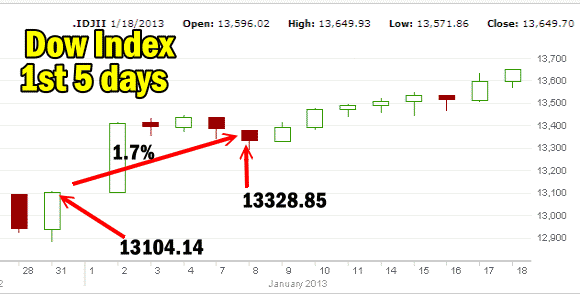
Market Direction and Dow First 5 Days
The Dow Jones was up 1.7% for the first 5 days of January and is now up 4.16% to January 18 2013.

Market Direction and Dow First 5 Days of January 2013
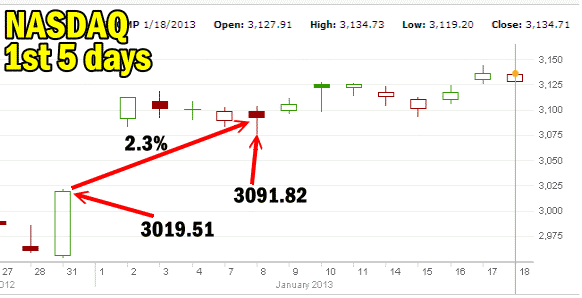
Market Direction and the NASDAQ Index First 5 Days
The NASDAQ Index despite the problems with Apple Stock and Intel Stock moved the most in the first 5 days up 2.3%. By January 18 the NASDAQ is up 115.2 points for a gain of 3.8%. Not too bad considering the problems some tech companies stocks have shown.

Market Direction and NASDAQ Index First 5 days of 2013
Market Direction and The Economy
Leaving the “voodoo” of the markets and its statistics aside, housing is continuing to rebound despite the record number of foreclosures in Florida. On top of housing the labor market continues to show strength and the transportation index made an all-time new high. Meanwhile the banking indexes and housing indexes are setting multiyear highs.
Market Direction and Technology Disappoints
The technology sector is continuing to disappoint and on Friday chipmaker Advanced Micro Devices stock fell more than 10 percent Friday following the results out of Intel which many analysts were disappointed in and feel show the decline of the personal computer being replaced by tablets and smartphones. Google Stock and Microsoft Stock report this week which should prove interesting. Despite all the bad news on chipmakers the sector index still posted its best close since April 2012.
Market Direction and Cash Inflows
Meanwhile investors are voting with their cash as more than $11.3 billion has ended up in stock funds over the past two weeks marking the highest inflow of cash into stocks since 2000.
Market Direction and Debt Ceiling Extension
The Republicans indicated this weekend that they were willing to extend the debt ceiling another 3 months while they try to wrangle some sort of deal for debt reduction to be built into the debt ceiling resolution. Neither party want to see continued and repeated crisis within the government and the economy which is a good sign. Whether they can come to a resolution is difficult to day.
Market Direction and Share Buybacks
The past year has seen companies buy back their own shares at break neck speed. To date US firms repurchases have outpaced new issues by $264 billion. Among those companies was Buffett’s own Berkshire Hathaway which saw value in buying back his own company shares in December to the tune of $1.2 billion as they picked up 9,200 shares. These kinds of figures are rare during periods of market contractions and even rarer during bear markets.
Market Direction Has A Lot Of Help Summary
Like any period in stock market history, the market direction is never straight up but the above information does give confidence that continuing to trade within securities while seeking to grow portfolios is not such a bad idea this year.
When looking at the history of the S&P 500 the January effect of the first 5 days is most telling when investors consider that this guideline warned in January 2007 and January 2008 that both years would end lower.
In 2009 the January effect for the first 5 days indicated markets would be higher. Let’s hope that this year the January effect for the first 5 days of the year holds fast and true and market direction ends the year higher than it started.
Internal Market Direction Links
Understanding Short-Term Signals
Market Direction Candlestick Daily View (Members only)
Market Direction Portfolio Ongoing Trades (Members only)
